Timing the stock market is no easy task – especially when panics hit the street. Buying stocks during vicious corrections is not for the faint-hearted, especially on days when the Dow Jones Industrial Average is down 1000 points.
During these times, “When will the stock market stop tanking?” is the prevailing question asked by investors looking to bargain shop.
The real question is “when is the right time to pull the trigger?” And many thought that the first dip two weeks ago was the time to get in.
However, the S&P 500 futures chart below with Buy and Sell signals generated by the Market Inflections algorithm tells a different story.
S&P 500 Futures Chart
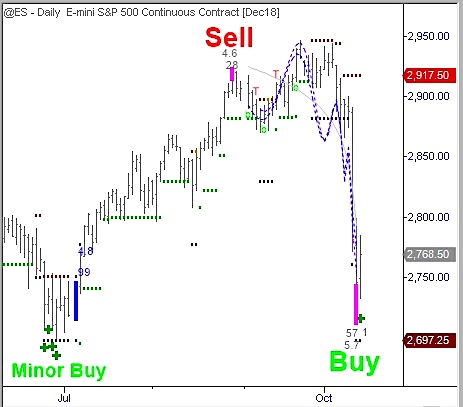
In late June 2018, these algorithms generated a series of what we call Minor Buy signals on the daily chart of the S&P 500 Futures Contract. And a few weeks later in early July, a Compression signal triggered suggesting a new trend was about to begin. Over the next few months, the S&P climbed more than 200 points.
In late August 2018, a Sell signal was generated. And now after a 250 point drop, a stock market Buy signal appeared last week which is statistically significant through early December 2018. Similar Buy signals were generated on the daily charts of the Nasdaq 100 and Russell 2000. As a result, we expect the recent downtrend to come to an end and sideways or higher price action to prevail over the next six to eight weeks.
Unfortunately, this is not the whole story (get the full report here for free). While the Buy signals on the daily charts of the major market indexes suggest that stocks should trade higher in the weeks to come, our algorithms have generated much larger Sell signals on both the weekly and monthly charts of the S&P 500 Futures Contract. The implication here is that while stocks are likely to recover in the short-term, any rally that unfolds will likely be temporary.
To read more about our algorithm’s long term market forecast, please visit the Market Inflections website to download a free copy of the our recent report titled “Our Market Outlook: The Good, The Bad and The Ugly”.
Thanks for reading! And be careful out there — volatility and average true ranges are likely to remain elevated. What we saw last week might just be a “pre-shock” of much greater market instability in the months and years to come.
Twitter: @larryfooter @mktinflections
The author is long SPY, QQQ, IWM call options, and S&P 500 futures at the time of publication. Any opinions expressed herein are solely those of the author, and do not in any way represent the views or opinions of any other person or entity.


