In this week’s investing research outlook, we discuss current trends and indicators for the S&P 500 Index (INDEXSP:.INX), while checking in on investor sentiment and market breadth. We’ll also discuss current investing themes and news that we are watching as 2018 kicks off.
Key Takeaways for the week ending January 5, 2018: Sentiment indicators show excessive and widespread (although not universal) optimism. Risks could rise if/when optimism reverses from extreme readings. For now, breadth and trend indicators continue to give the benefit of the doubt to the bullish case.
Surging Investor Sentiment
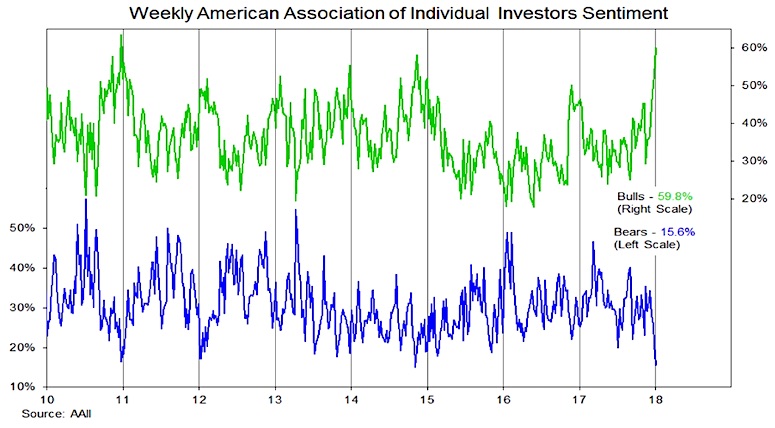
The latest sentiment survey from the American Association of Individual Investors (AAII) shows a continued shift away from caution and toward optimism. For much of 2017, individual investors took a relatively cautious view on the stock market. That apparently changed toward the end of the year. Since mid-November, bears have fallen from 35% to 16% (their lowest level since 2014) and bulls have risen from 29% to 60%, their highest since 2010. The excessive optimism now evident in the AAII survey is consistent with the excessive optimism reported among advisory services. In fact it matches it almost exactly. The latest survey from Investors Intelligence shows 62% bulls and 15% bears, levels that have been relatively stable since October.
Surging optimism among individual investors could be source of near-term strength for stocks, especially if recently cautious investors increase their exposure to equities. Our view on this is mixed – recent fund flow data shows outflows from equity funds, but other data (including an asset allocation survey from AAII) suggests there is actually a scarcity of cash on the sidelines. Looking further out, however, risks rise and stocks have historically been vulnerable when sentiment reverses after reaching excessive levels.
Equity Fund Flows
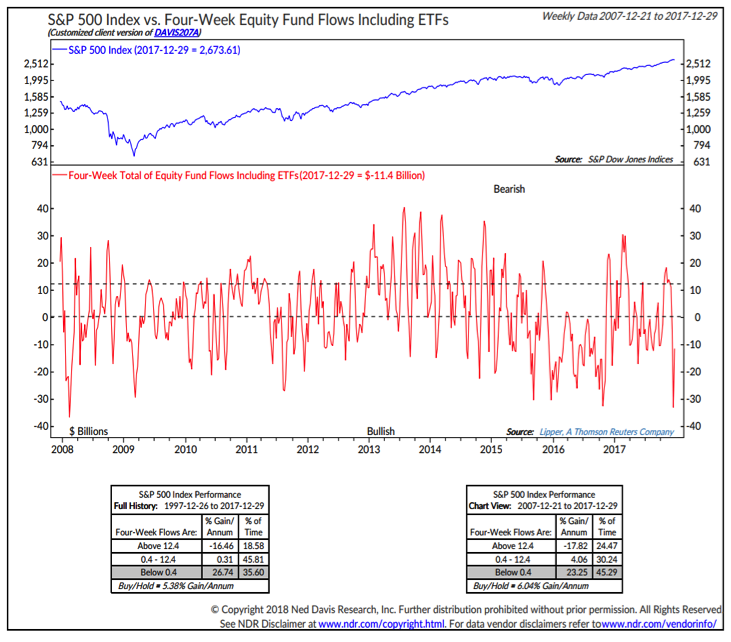
In contrast to the sentiment survey data, fund flow data shows a degree of caution among investors, with equity funds seeing outflows. Fund flows have been a historically reliable contrarian indicator. Stocks have tended to do well when fund flows are negative and stocks have struggled when investors have piled into equities. While there may be room for equities to continue to rally as investors start to shift funds back to equities, history suggests upside is more limited if/when we start to see inflows surge.
The caveat to this is that other data sources suggest there is actually relatively little cash on the sidelines. The AAII asset allocation survey shows highest exposure to equities and the lowest exposure to cash since 2000.
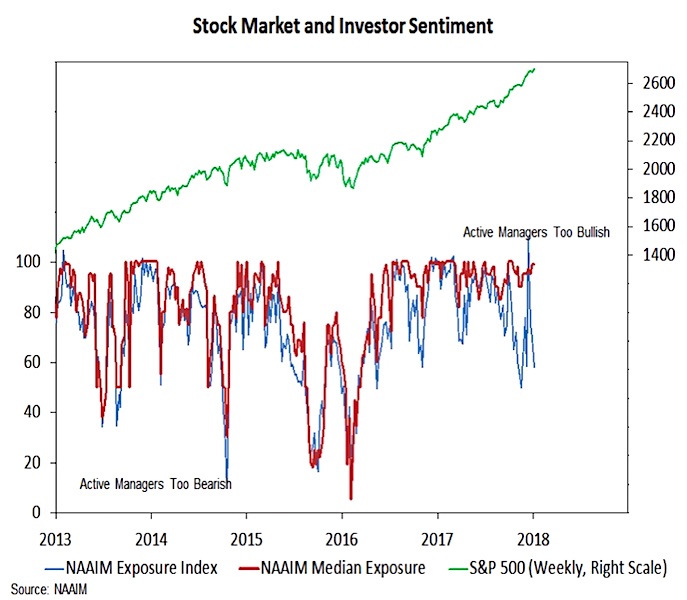
In addition to the survey data from AAII and Investors Intelligence, we also keep a close eye on the NAAIM survey of active investment managers. Here, sentiment, as measured by the Exposure Index, has fluctuated considerably in recent months. The Exposure index was at 96% in September, dropped below 50% in November, surged to its highest level on record (109%) in December and came in below 60% this week. It appears that outliers are distorting the index. The median exposure has been much more stable, holding between 90% and 100% (currently 99%) since September. If this begins to move meaningfully lower, it could be evidence that sentiment has reversed after reaching excessive optimism.
S&P 500 Technical Chart
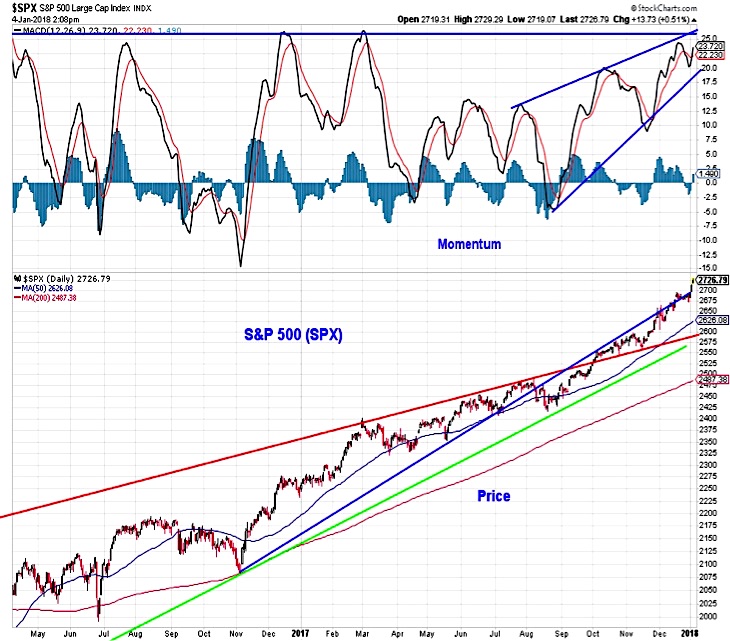
While stocks may be vulnerable to a shift in sentiment, the path of least resistance remains higher for now. The S&P 500 is on pace to begin the year with three consecutive all-time highs, something that has not happened since 1964 and after stalling in the second half of December, momentum has again turned higher for the index. The rally continues to enjoy broad support. Nearly 80% of the stocks that comprise the index are trading above their 50-day moving average and a similar percentage are trading above their 200-day average.
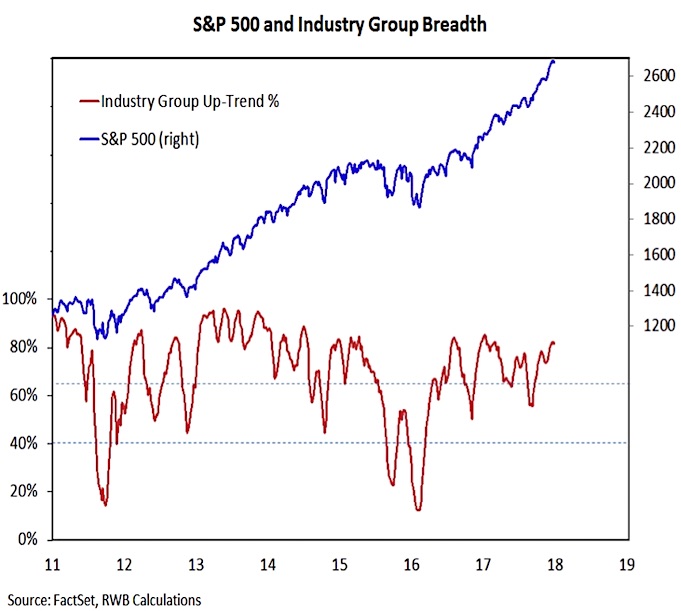
Sector Level Trends & Market Breadth
Our sector-level trend indicator has pulled back since mid-December, but remains above its November low, evidence that sector-level price, momentum and breadth trends remain generally supportive of index-level strength. Our measure of industry group trend strength remains near its recent highs, bolstering the view that the index-level rally continues to have ample support beneath the surface.
While the sentiment data suggests risks could be rising, breadth remains strong as the indexes make new highs and the overall weight of the evidence continues to give the benefit of the doubt to the bulls.
Thanks for reading.
Twitter: @WillieDelwiche
Any opinions expressed herein are solely those of the author, and do not in any way represent the views or opinions of any other person or entity.


