The U.S. stock market indexes are trading sideways.
The S&P 500 (NYSEARCA:SPY) should see some downside pressure this week, however.
S&P 500 Cycle Outlook for the Week of September 17, 2018:
– Stocks rose last week, with the S&P 500 (SPX) up 34 points to 2905, an increase of 1.2%.
– This occurred as Trump vowed to continue his China trade policy and two of his allies agreed to cooperate in the Russia investigation.
– Our projection this week is for the SPX to edge up and then fall to the support zone between 2860-2880.
“Market Week” Video
President Trump confirmed that the administration would proceed with its current course of action on China trade policy. This occurred even as Treasury Secretary Steve Mnuchin reached out to China in an attempt to restart the stalled trade talks.
Surrounding all of this, Trump’s political situation at home worsened as two allies, Michael Cohen and Paul Manafort, agreed to cooperate in the Russia investigation.
Meanwhile, Apple (AAPL) launched its 2018 product lineup on Wednesday, with the stock jumping 2%. It did not follow through however, bouncing around in the following days, based in part on a quantitative comparison of past iPhone launch events, which pointed to lower sales.
The latest inflation data fell short of the average forecast, with the producer price index for August coming in at -0.1% versus 0.2% expected, and consumer inflation at 0.1% versus 0.2%. Retail sales, another measure of consumer spending, also came in below expectations.
Fed heads have been talking up economic strength recently, for example Charles Evans noted, “The economy is firing on all cylinders, with strong growth, low unemployment, and inflation approaching our 2% target.”
Evans added that he expects the growth to continue for the coming years. Nonetheless, with the 30 year bond futures (/ZB) falling 1% on the week, our outlook is for more choppiness in interest rates, as described in the latest askSlim Market Week.
Even with bonds down, the dollar index also fell 0.5%, and our outlook on the dollar is for even more weakness, which we discuss further in the Market Week show.
S&P 500 (SPX) Daily Chart
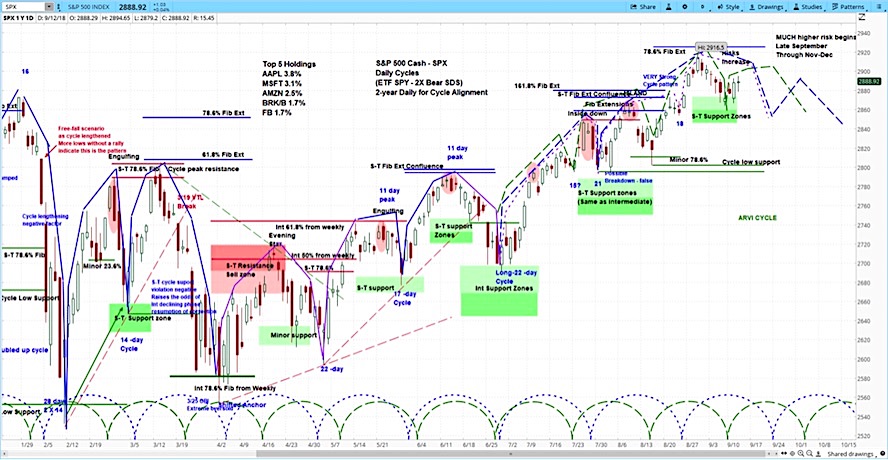
Our analysis of the S&P 500 is for the stocks to continue with some minor upside before the declining phase of the current market cycle begins. Our minor support zone is between 2860-2880. Yet once we hit late September, we see the potential for much higher risk, which should last through the end of the year.
Twitter: @askslim
Any opinions expressed herein are solely those of the author, and do not in any way represent the views or opinions of any other person or entity.


")


 Rolling Over At Key Fibonacci Level?")