We follow market breadth to give us an indication about the health of the trend.
And since the market as been consolidating the past four months, we will do a deep dive to gather evidence of which way the market may break. We’ll focus on the S&P 500 Index (INDEXCBOE:.INX).
Let’s dig in…
The equally weighted S&P 500 relative to the capitalization weighted S&P 500 remains below the 200-day moving average and it appears that the ratio will require more time to form a base (see chart above). Bulls want to see this trend reverse to signal that smaller stocks in the index are participating to the upside to the same degree or greater than the larger stocks in the index.
In an encouraging development, the RSI of the ratio has made higher lows recently and has not become oversold with recent price declines.
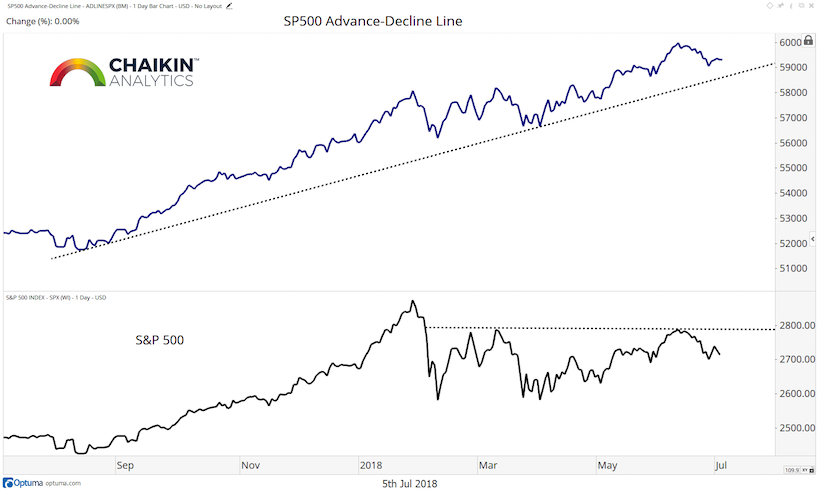
The Advance / Decline line remains in an uptrend even as the index continues to consolidate. The fact that this metric remains in an uptrend is one of the data points behind our view that the market is consolidating within the secular uptrend and is likely to resolve higher.
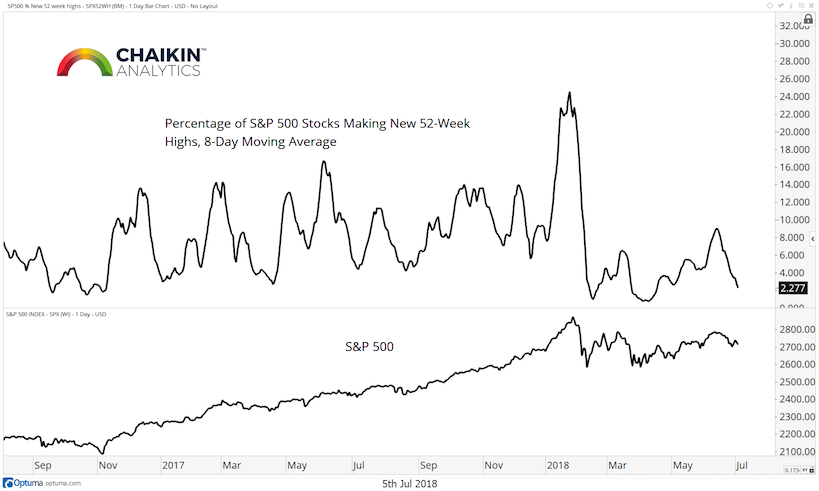
Next, we look at the percentage of stocks in the index making new 52-week highs. This is an 8-day moving average of S&P 500 stocks making new 52-week highs. This measure has moved down to 2.27% as the market contends with the most recent round of trade tension headlines. On data back to 1968, when this metric is greater than 2%, the S&P 500 is higher one quarter later (65 days) 67% of the time for a median return of 2.74%.
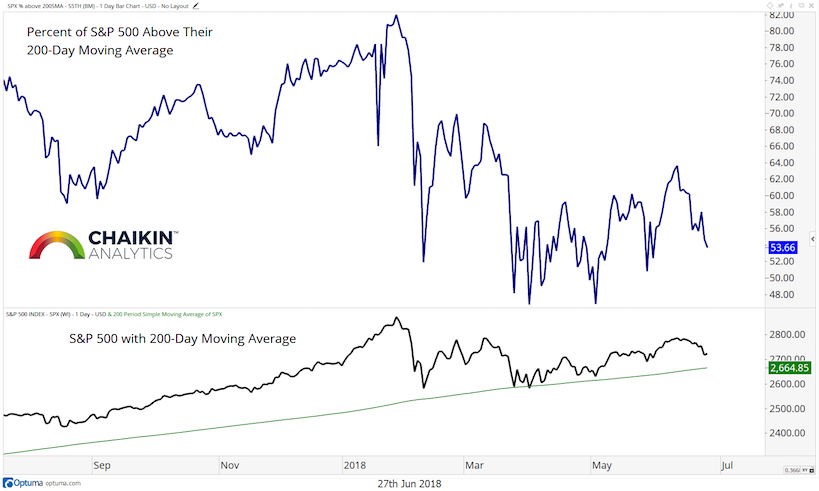
The percentage of stocks trading above their respective 200-day moving averages fell to 52% from 53% last week. When this metric is over 50%, the market is higher one quarter later (65 days) 80% of the time for a median return of 3.54% based on data back to 2010.
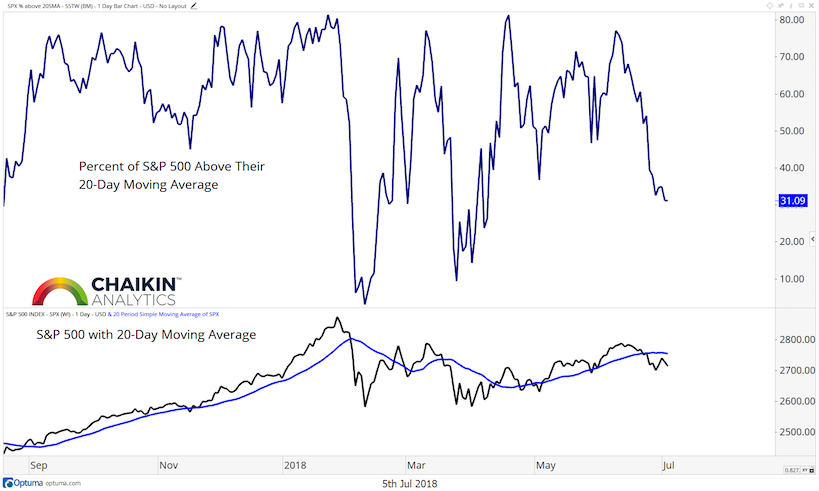
When we look at the percentage of stocks above their respective 20-day moving averages, we can see the reading has moved down to 31% from 37% last week. Since 2010, when this metric is over 30%, the S&P 500 is higher one quarter later (65 days) 78% of the time with a median return of 3.45%.
Takeaway:
The breadth measures which we track continue to moderate as the S&P 500 remains in a consolidation. There is not enough deterioration for us to change our view that the consolidation is taking place in the context of a secular uptrend. However, we would like to see some stronger breadth readings to increase the odds the upside resolution.
You can gain more insights into our methodology and stock picking over at Chaikin Analytics. Thanks for reading.
Twitter: @DanRusso_CMT
Author may have a position in mentioned securities at the time of publication. Any opinions expressed herein are solely those of the author, and do not in any way represent the views or opinions of any other person or entity.


