Stock market bulls have had a rough go of it lately. After touch up as high as 4100 last week, the S&P 500 dropped to 3850 in 4 sessions closing the week below 3900 and triggering a sell signal.
Further, the S&P 500 was headed lower on Monday again.
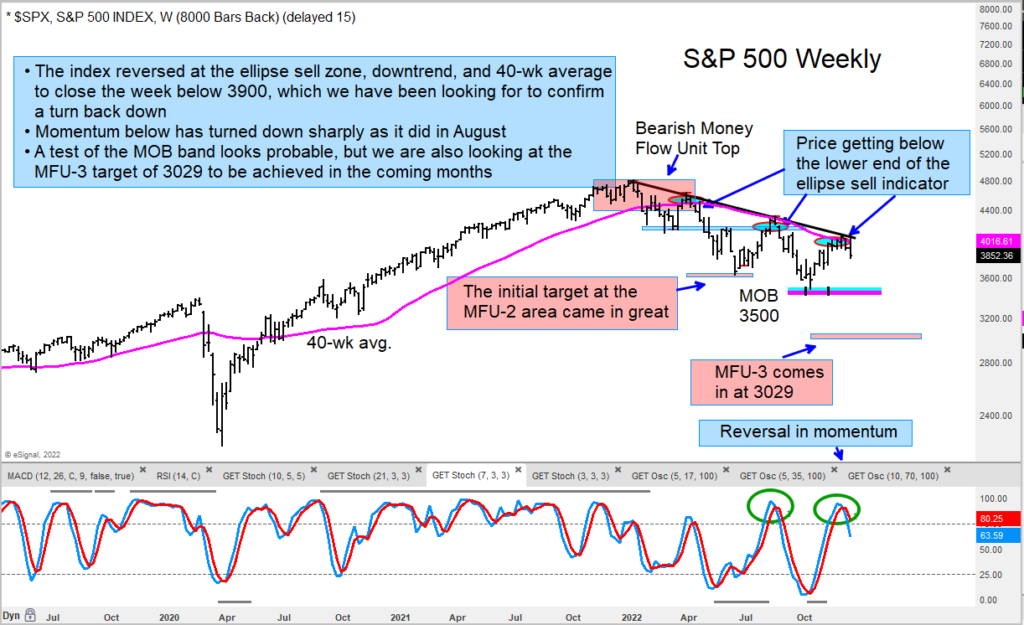
The index is now trading below the lower end of its ellipse sell signal (reversal).
Using the longer-term “weekly” trading chart, we come up with downside price targets of 3500 (MOB band) and the MFU-3 price target at 3029.
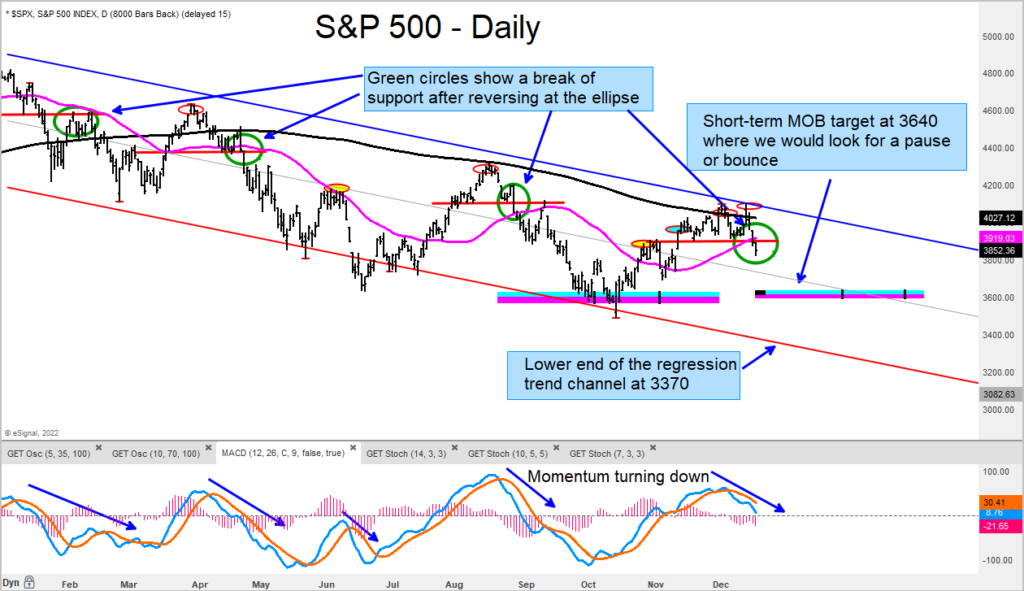
On the shorter-term “daily” chart, we see 3640 come up as a potential support level for a bounce and 3370 as lower channel support.
This bear market appears to have another leg lower.
Twitter: @GuyCerundolo
The author or his firm have a position in mentioned securities at the time of publication. Any opinions expressed herein are solely those of the author, and do not in any way represent the views or opinions of any other person or entity.


