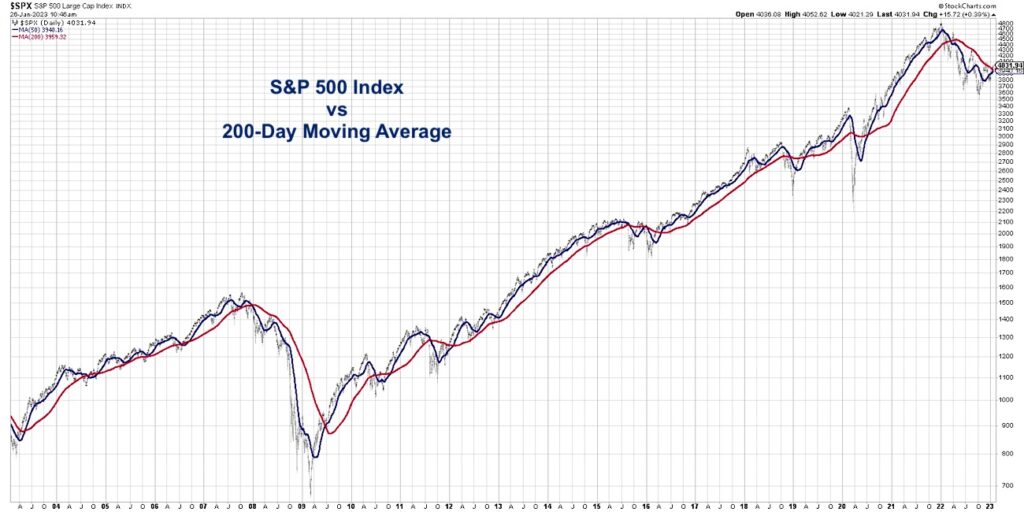
The S&P 500 index is once again testing its 200-day moving average. Previous tests of the 200-day in August and November of 2022 ended abruptly with the moving average repelling the advance.
So why would this time be any different?
In today’s video, we’ll discuss three ways to use the 200-day moving average and review historical signals of when these indicators have turned bearish or bullish. We’ll also dig into the most recent rally off the October 2022 low and describe how the higher low in December may be a leading indicator of underlying strength for stocks.
What’s next for the S&P 500? It all starts with the 200-day moving average.
- What does an impending “golden cross” mean based on historical patterns after these signals?
- Why is the slope of the 200-day moving average an important trend-following gauge?
What other indicators can we use to validate or confirm the signals we see from the price and 200-day moving average?
VIDEO: S&P 500 vs 200 Day MA
Twitter: @DKellerCMT
The author may have positions in mentioned securities at the time of publication. Any opinions expressed herein are solely those of the author, and do not in any way represent the views or opinions of any other person or entity.


 Flirting With Critical Support… Again")