S&P 500 Index “monthly” Chart
The stock market rally has taken the S&P 500 Index all the way back to an important price point on the “monthly” chart.
And how the index closes during the summer months may provide further direction to investors, starting with June.
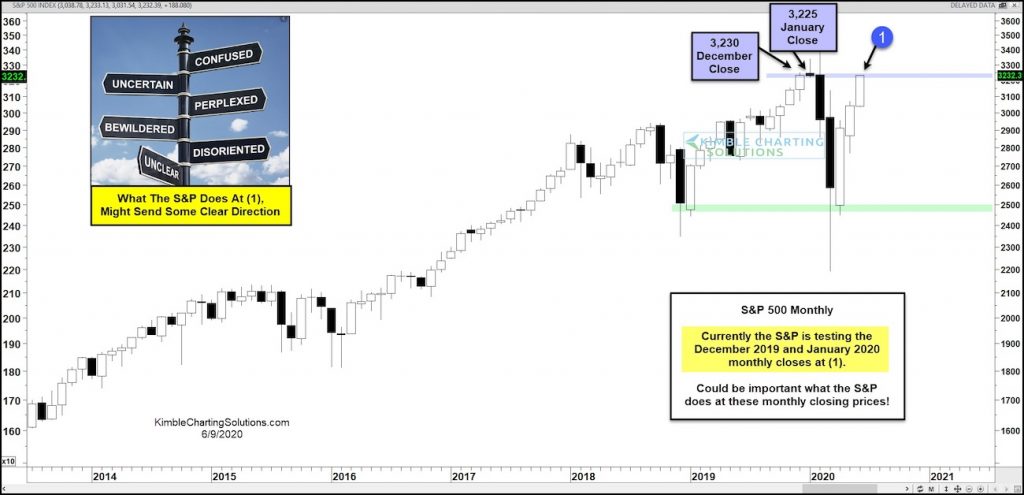
As you can see in today’s chart, the S&P 500 is testing the December 2019 and January 2020 monthly closing levels at (1).
It will be important what the S&P 500 does at these monthly closing prices! The S&P’s next move could go a long way to providing some direction. Stay tuned!
Note that KimbleCharting is offering a 2 week Free trial to See It Market readers. Just send me an email to services@kimblechartingsolutions.com for details to get set up.
Twitter: @KimbleCharting
Any opinions expressed herein are solely those of the author, and do not in any way represent the views or opinions of any other person or entity.


: Showing Some Signs of Emerging Strength")
