Stocks have come under pressure and concerns are beginning to mount.
But rather than zooming in on the short-term, sometimes it’s good to zoom out and look at the long-term technical picture. And in today’s case, it may very well lead us to the short-term outcome as well!
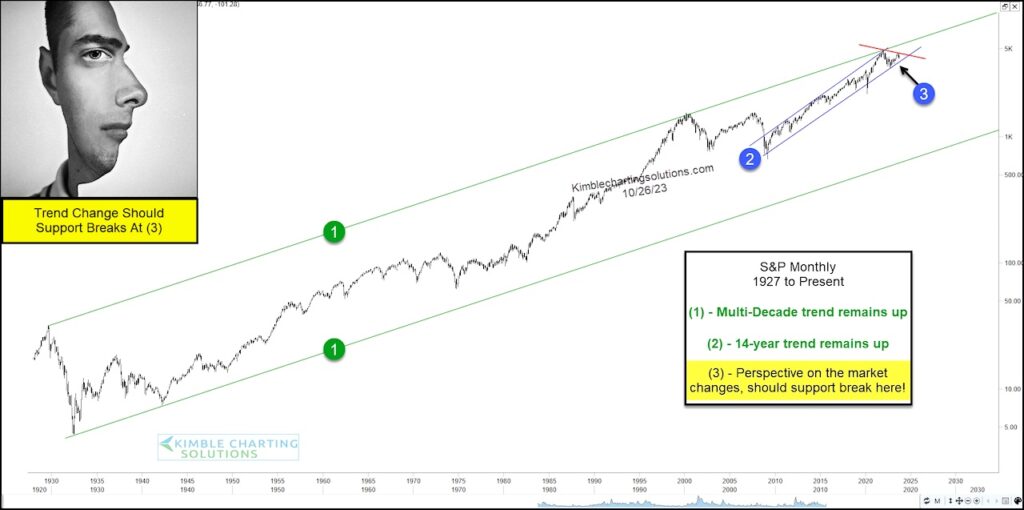
Below is a “monthly” chart of the S&P 500 Index.
As you can see, its multi-decade trend remains up at each (1). And it’s long-term trend remains up at each (2).
But this is where things get tricky. The peak in 2021 came at the long term trend channel resistance. We then turned down from there. We then saw a small bounce off the 14-year uptrend line marked by (2) before making a lower high. And now price is compressing at (3).
So while the trend remains higher for now, it is very important what happens in the coming weeks. Let’s just say that bulls need support to hold at (3). Stay tuned!
S&P 500 Index “monthly” Chart
Note that KimbleCharting is offering a 2 week Free trial to See It Market readers. Just send me an email to services@kimblechartingsolutions.com for details to get set up.
Twitter: @KimbleCharting
Any opinions expressed herein are solely those of the author, and do not in any way represent the views or opinions of any other person or entity.


