After showing clear signs of distribution on Friday of last week through Monday of this week, the S&P 500 Index has once again bounced off its 50-day moving average.
So what’s next? What do the S&P 500 Index forecasts say?
Do we see a retest of previous highs and continued upside despite the seasonally weakest part of the year? Do we blow through the 50-day moving average before reaching to the 200-day and beyond?
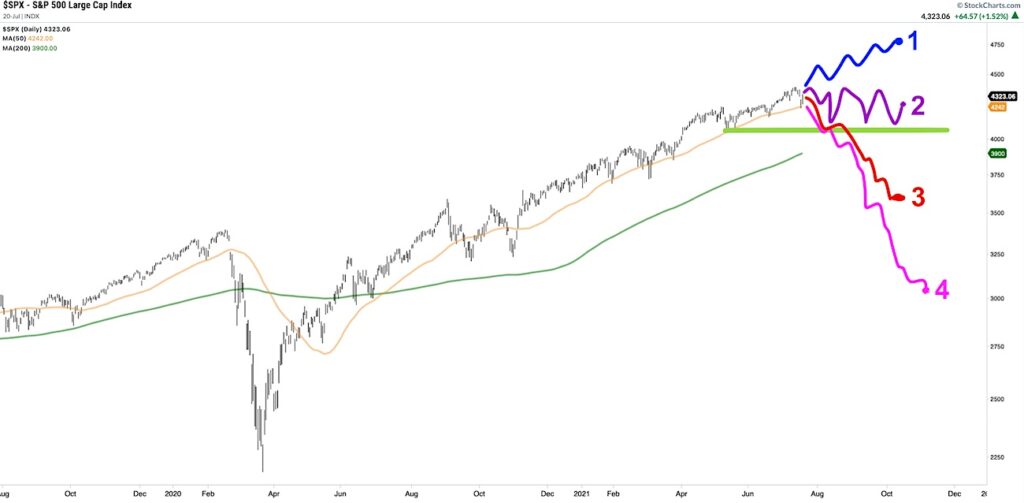
In the spirit of a “choose your own adventure” story, we can lay out four potential future paths for the S&P 500, describe how each scenario would play out, and most importantly think about how a portfolio may fare based on each of those different outcomes.
In today’s video, we’ll discuss four potential paths for the S&P 500 in the next six weeks: the bullish scenario, the rangebound scenario, the minor correction scenario and the dreaded doomsday scenario. Which of these S&P 500 forecasts is most likely, and why? Here are some questions we ask:
– What’s the probability of the S&P 500 gaining another 10% from current levels versus a 10% loss to push the S&P down to its 200-day moving average?
– What’s the likelihood of a repeat of the 2020 market selloff and what would need to happen to cause that sort of downturn?
– How would a portfolio perform given these different potential scenarios, and for which one are you most well-positioned?
For deeper dives into market awareness, investor psychology and routines, check out my YouTube channel!
[VIDEO] One Chart: S&P 500 Forecast
S&P 500 Index Chart w/ Potential Future Paths
Twitter: @DKellerCMT
The author may have positions in mentioned securities at the time of publication. Any opinions expressed herein are solely those of the author, and do not in any way represent the views or opinions of any other person or entity.

 Rolling Over At Key Fibonacci Level?")


