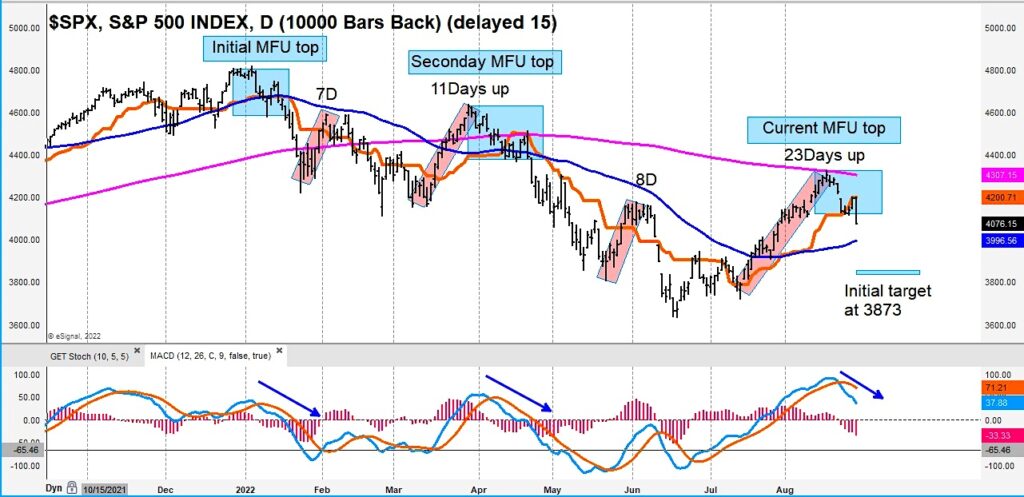
The S&P 500 Index has formed a bearish Money Flow Unit (MFU) top based on its near-term “daily” price chart.
This formation is similar to what we saw in January and April this year, where the most recent high failed just under the previous MFU top.
The most recent bear market rally was 23 days in duration measured off the mid-July pivot low. Most investors will be targeting the 50-day at 3997, which is a logical place from here, but our MFU work has an initial target in the 3873 area.
Regardless of the near-term targets, I have avoided playing much other than in Energy on the long side as structure there has been stronger than other sectors. The other unknown has been how much of a rally will we get in a “bear market rally”? As you can see in the chart below the rallies have been 7, 11, 8, and 23 days and for reasons like this, I have focused on the weekly and monthly big picture call in our weekly work.
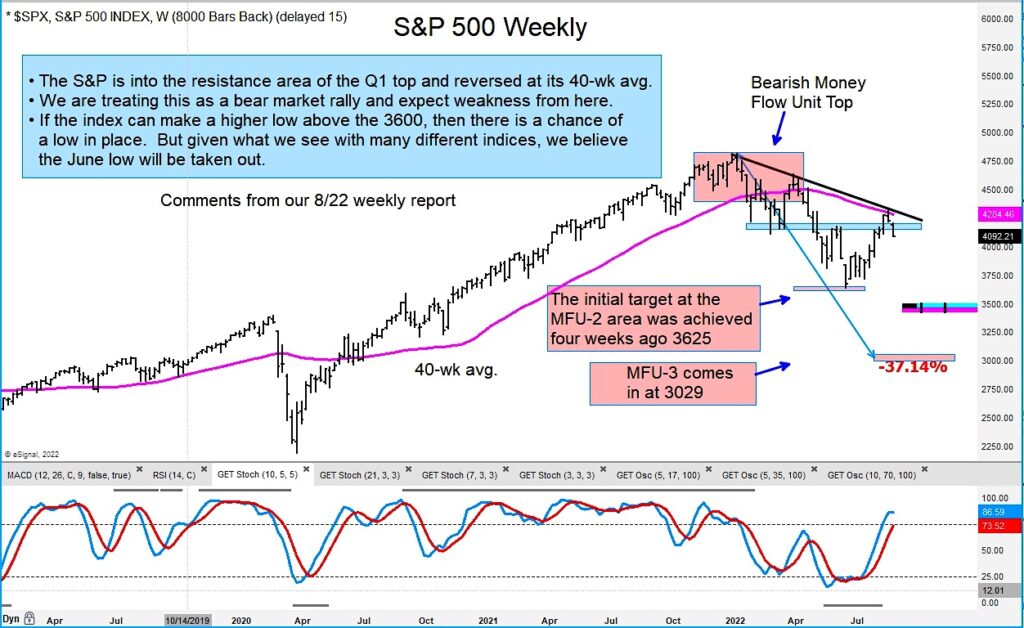
The first chart below is that of the “daily” S&P 500 Index that shows the current and previous two MFU tops. The second chart is the “weekly” chart.
Twitter: @GuyCerundolo
The author or his firm have a position in mentioned securities at the time of publication. Any opinions expressed herein are solely those of the author, and do not in any way represent the views or opinions of any other person or entity.

 Rolling Over At Key Fibonacci Level?")


