Outlook for May 5 S&P 500 Futures – After struggling yesterday, S&P 500 futures charts managed to hold the 2046 support level by day’s end. If we’re bullish on the charts, we’re not quite out of the woods yet, as we struggle to breach new overhead supply near 2061.5.
We’ll see range bound behavior very vulnerable to selling if we cannot breach 2063.5 and hold; and in these formations, we’re very likely to see resistance levels will be tested and sold across stock market futures today.
If we are able to keep the 2061.5 area on any bounce, buyers will be more likely to add steam to the retrace upward back into resistance near 2068.75, before sellers try to force buyers back down. If not, we’ll see that 2045-2046 again, and the drift into the eventual target at present, 2034, will likely continue. If buyers completely step out of the way, we’ll have that move into 2031. Deep pullbacks like this without any retrace intraday will bring buyers into the fray as we are still solidly in congestion.
Momentum on the four hour chart is negative, but lifting, suggesting that bounces in the stock market will be still be sold. Several lines of sellers are poised to prevent the advance of price upward – 2061, 2063.5 and 2068.5. Support levels sit near 2034-2031.
See today’s economic calendar with a rundown of releases.
THE RANGE OF TUESDAY’S MOTION
Crude Oil Futures (CL_F)
Outlook for May 5 Crude Oil Futures – As long as charts can hold 44, or recover it quickly, crude oil prices will keep the current bullish slant.
The trading range on crude oil suggests support action near 43.4, and resistance behavior near 45.64.
Upside trades is likely on the positive retest of 44.15, or a positive retest of 44.54 with positive momentum. I often use the 30min to 1hr chart for the breach and retest mechanic. Targets from 44.15 are 44.48, 44.68, 44.94, 45.14, 45.42, 45.72, 46.05, and if we can catch a bid there, we could expand into 46.53 to 46.94, but that seems extremely unlikely as overhead supply seems heavy.
Downside trades on crude oil are countertrending right now, but seem feasible below the failed retest of 44.57, or at the failed retest of 45.64 with negative divergence – careful to watch for higher lows there at the short on the stretch upward. Retracement into lower levels from 45.67 give us the targets 45.24, 44.94, 44.68, 44.48, 44.24, 44.11, 43.94, 43.65, 43.53, 43.34, 43.03, and perhaps 42.9, to 42.68, and 42.34.
E-mini S&P 500 Futures (ES_F)
Below is a S&P 500 futures chart with price support and resistance trading levels for today. Click to enlarge.
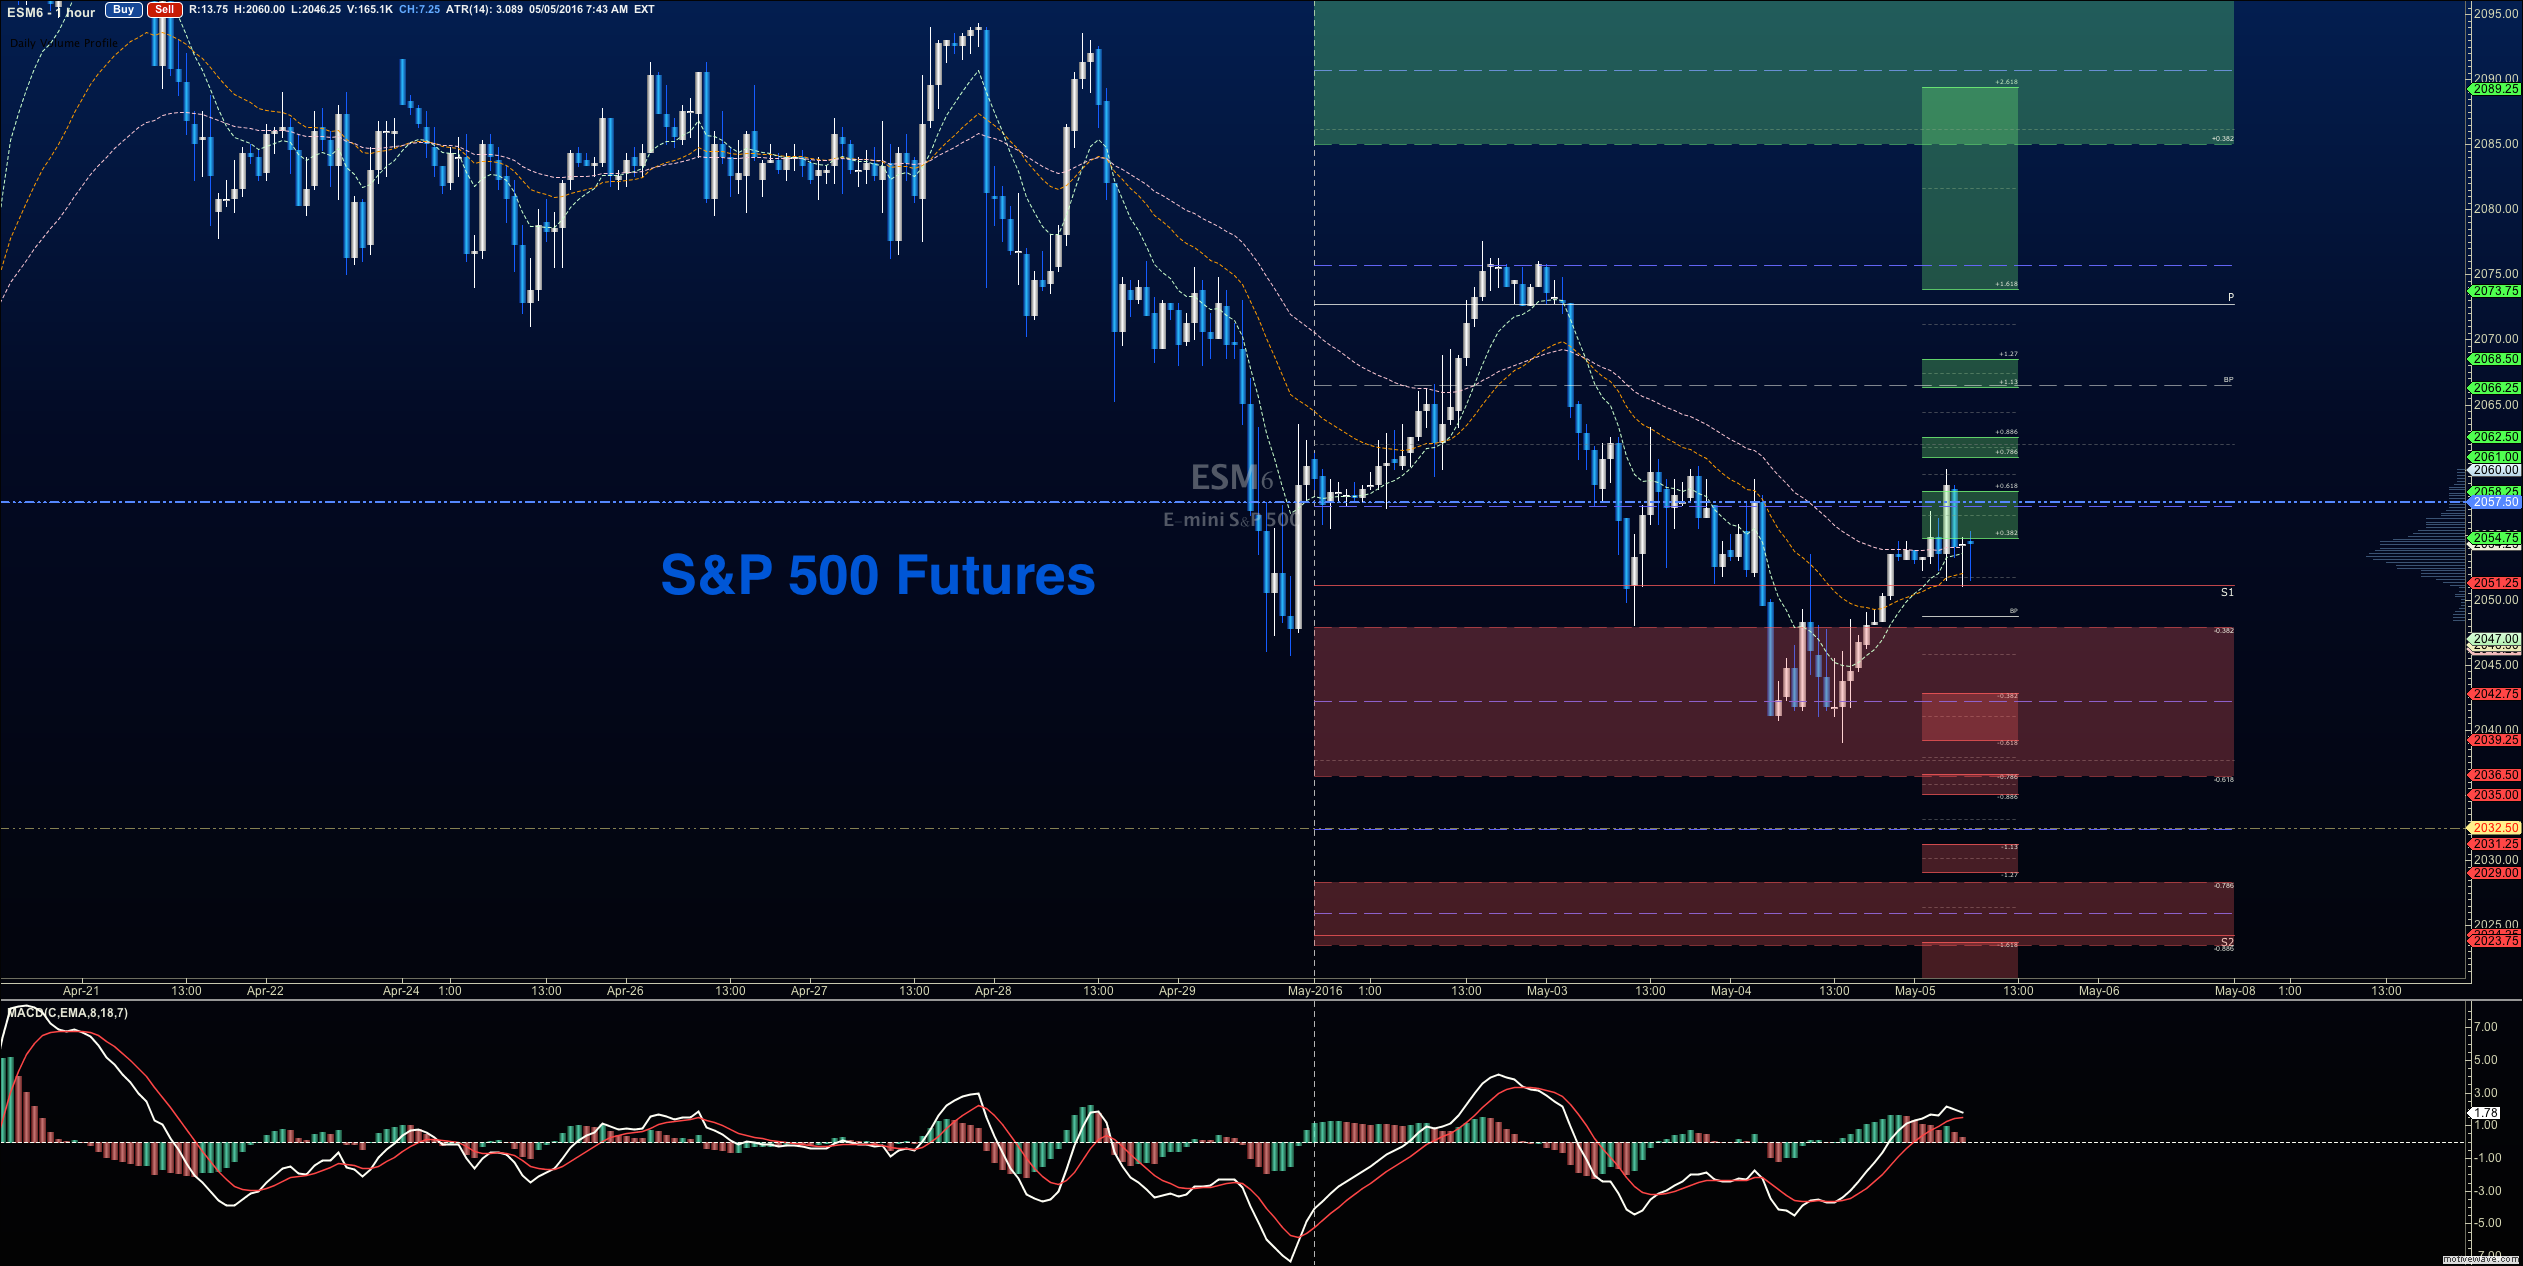
S&P 500 Futures Outlook for May 5 – Negative momentum with negative trend is still in the lead, but a bounce into support is struggling to hold.
Upside trades will be into resistance with the 4hour time frame in mind, but the best setup sits on S&P 500 futures would be a positive retest of 2049.5, or a bounce off 2045.5 with positive momentum – keep your eyes on 2048.25 with this 2045.5 entry. I use the 30min to 1hr chart for the breach and retest mechanic. Targets from 2045.5 are 2047.25, 2049.5, 2053, and if we can catch a bid there, we could expand into 2057.5, 2060.25, 2063.5, and 2067.25. Long action is still trending over the bigger picture for now, but momentum continues to slow, and pullbacks seem quite frequent at resistance zones, raising concern on the strength of trend holding.
Downside trades on S&P 500 futures open below the failed retest of 2049 or at the failed retest of 2060.25 with negative divergence. The short at 2060.5 should be carefully watched intraday for higher lows developing to signal that buyers have drifted into the space and want to force the chart up. Retracement into lower levels from 2060.25 gives us the targets 2057, 2054.4, 2051.5, 2046.5, 2040.5, 2037.75, 2034.5, and perhaps 2031.25 to 2029.25.
If you’re interested in the live trading room, it is now primarily stock market futures content, though we do track heavily traded stocks and their likely daily trajectories as well – we begin at 9am with a morning report and likely chart movements along with trade setups for the day.
As long as the trader keeps himself aware of support and resistance levels, risk can be very adequately managed to play in either direction as bottom picking remains a behavior pattern that is developing with value buyers and speculative traders.
Twitter: @AnneMarieTrades
The author trades stock market futures every day and may have a position in mentioned securities at the time of publication. Any opinions expressed herein are solely those of the author, and do not in any way represent the views or opinions of any other person or entity.

")

 Rolling Over At Key Fibonacci Level?")


