Stock Market Futures Trading Considerations For June 3, 2017
The S&P 500 (INDEXSP:.INX) held above its weekly lows and is now bouncing higher into Monday’s pre-holiday shortened session. See key trading support/resistance levels below.
Check out today’s economic calendar with a full rundown of releases. And note that the charts below are from our premium service and shared exclusively with See It Market readers.
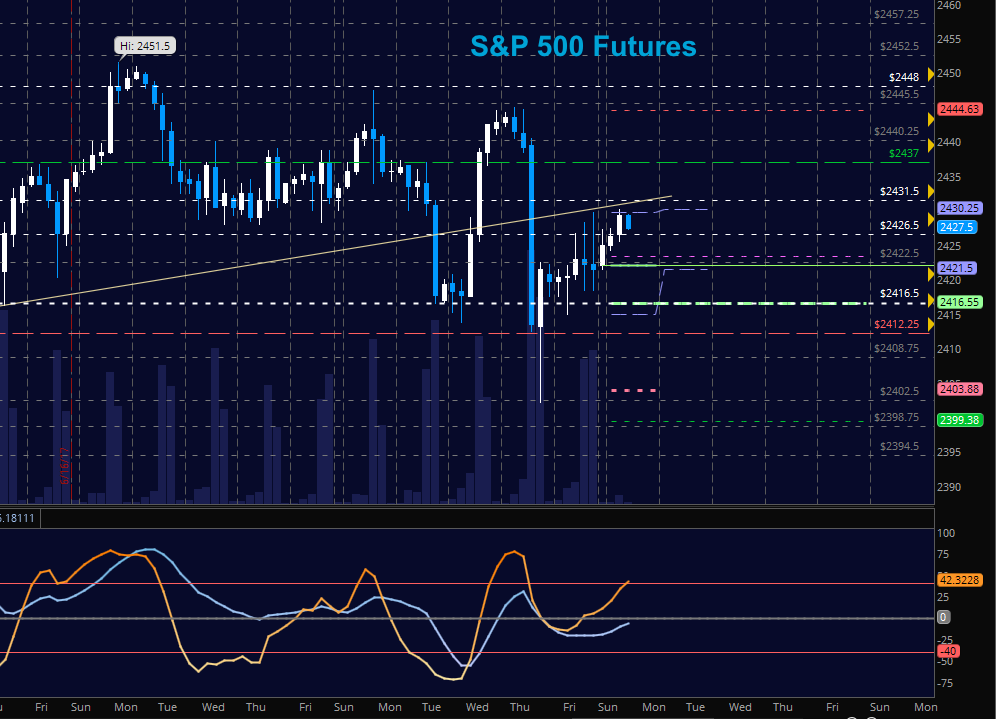
S&P 500 Futures (ES)
As suspected, we held the lows of Thursday and now are in a bounce pattern battling at zones of conflict near 2428. Momentum is mixed and I expect trading to be half-hearted as the markets are closed tomorrow. The bullets below represent the likely shift of trading momentum at the positive or failed retests at the levels noted.
- Buying pressure intraday will likely strengthen above a positive retest of 2431 (careful again here with resistance)
- Selling pressure intraday will likely strengthen with a failed retest of 2420
- Resistance sits near 2434.5 to 2439, with 2445.5 and 2448.5 above that.
- Support holds between 2422.5 and 2417.25, with 2412.75 and 2402.5 below that.
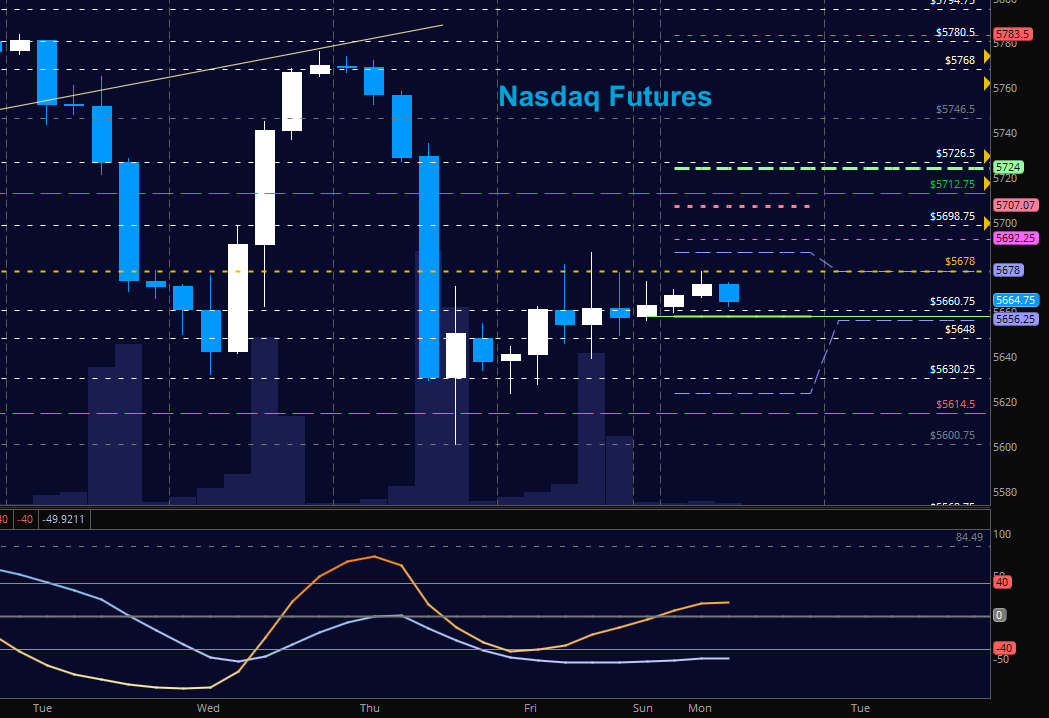
NASDAQ Futures (NQ)
So far, buyers have failed to recapture and defend 5672 leaving sellers still in control of this chart, even as we bounce this morning with the other indices. We also show lower momentum than the other charts we follow. With the range of motion in the NQ_F expanding over these last few days, we are still looking at intraday ranges of more than 90 points….so caution of the perceived edges of motion is suggested. The bullets below represent the likely shift of intraday trading momentum at the positive or failed tests at the levels noted.
- Buying pressure intraday will likely strengthen with a positive retest of 5682.5
- Selling pressure intraday will likely strengthen with a failed retest of 5632.5
- Resistance sits near 5698.75 to 5726.5, with 5748 and 5803.25 above that.
- Support holds between 5642.75 and 5630.75, with 5614.75 and 5600.5 below that.
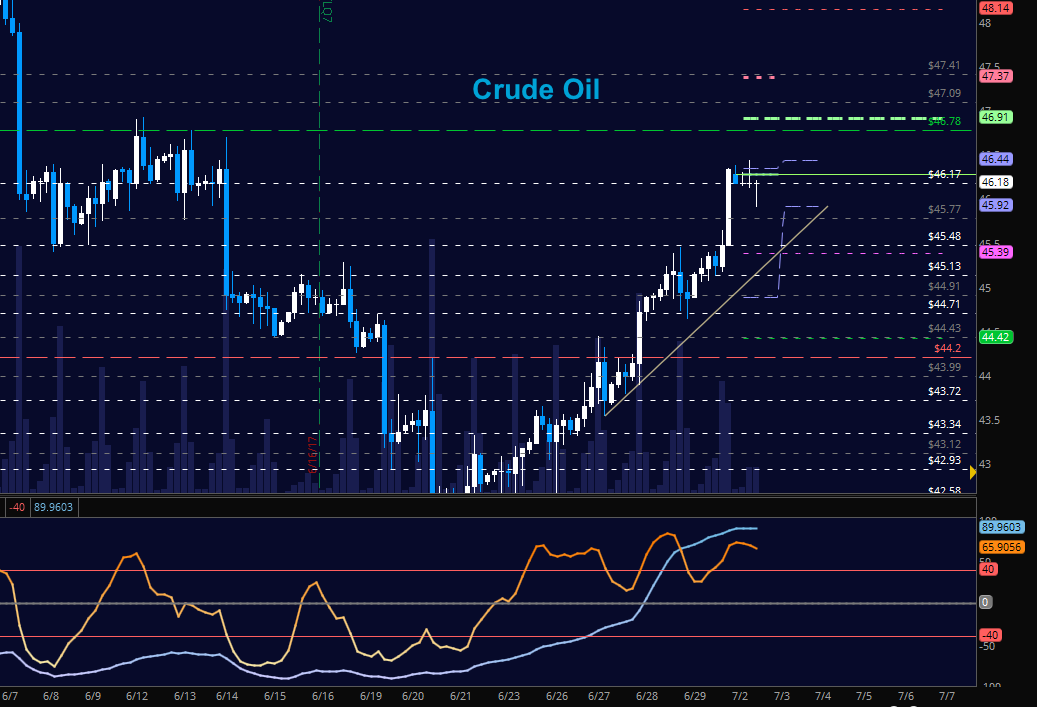
WTI Crude Oil
In a strong early morning move, traders have taken WTI to 46.2 with highs near 46.4 – which is quite close to our targets near 46.8. We’ll be watching this area as we see who might win the fight here. Formations still suggest that pullbacks will find buyers, but we are quite close to very strong areas of resistance. The bullets below represent the likely shift of trading momentum at the positive or failed tests at the levels noted.
- Buying pressure intraday will likely strengthen with a positive retest of 46.48
- Selling pressure intraday will strengthen with a failed retest of 45.7
- Resistance sits near 46.48 to 46.8, with 47.14 and 47.41 above that.
- Support holds between 45.78 to 45.5, with 44.6 and 44.2 below that.
If you’re interested in watching these trades go live, join us in the live trading room from 9am to 11:30am each trading day. Visit TheTradingBook for more information.
If you’re interested in the live trading room, it is now primarily stock market futures content, though we do track heavily traded stocks and their likely daily trajectories as well – we begin at 9am with a morning report and likely chart movements along with trade setups for the day.
As long as the trader keeps himself aware of support and resistance levels, risk can be very adequately managed to play in either direction as bottom picking remains a behavior pattern that is developing with value buyers and speculative traders.
Twitter: @AnneMarieTrades
The author trades stock market futures every day and may have a position in mentioned securities at the time of publication. Any opinions expressed herein are solely those of the author, and do not in any way represent the views or opinions of any other person or entity.


