Broad Stock Market Futures Outlook for May 25, 2018
Buyers continue to defend the edges of support as traders jockey for positioning into the long weekend for the U.S. market.
We begin the day looking bullish, but as we have seen many times, buying the breaches of resistance have exposed the trader to unnecessary risk. Continue to watch the edges and wait for the trade to come to you. Chasing trades will be particularly trying.
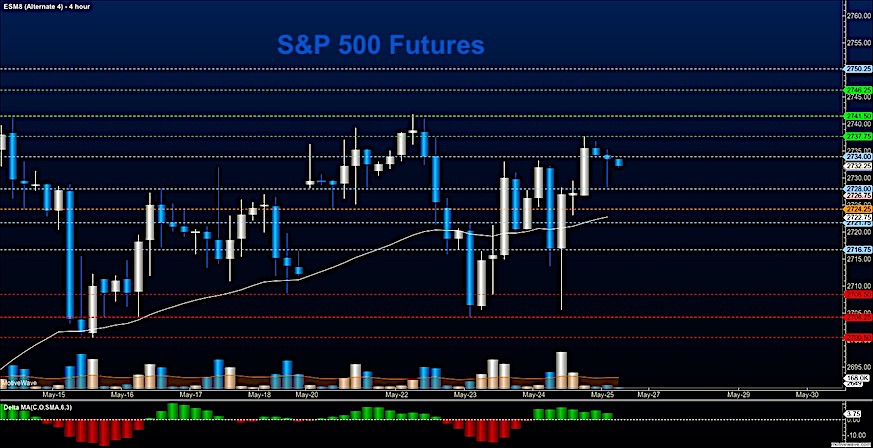
S&P 500 Futures
Into the long weekend, we hold higher support here- Holding above 2735 will allow for the press upward into higher resistance but we’ve had trouble with that, and with the topping formation seen on the 4 hour chart, it seems a test of support before engaging in a move higher might be prudent. The bullets below represent the likely shift of trading momentum at the successful or failed retests at the levels noted.
- Buying pressure intraday will likely strengthen with a bullish retest of 2735.75
- Selling pressure intraday will likely strengthen with a bearish retest of 2724.5
- Resistance sits near 2737.5. to 2741.75, with 2747.75 and 2754.5 above that
- Support sits between 2727.75 and 2722.5, with 2716.5 and 2708.75
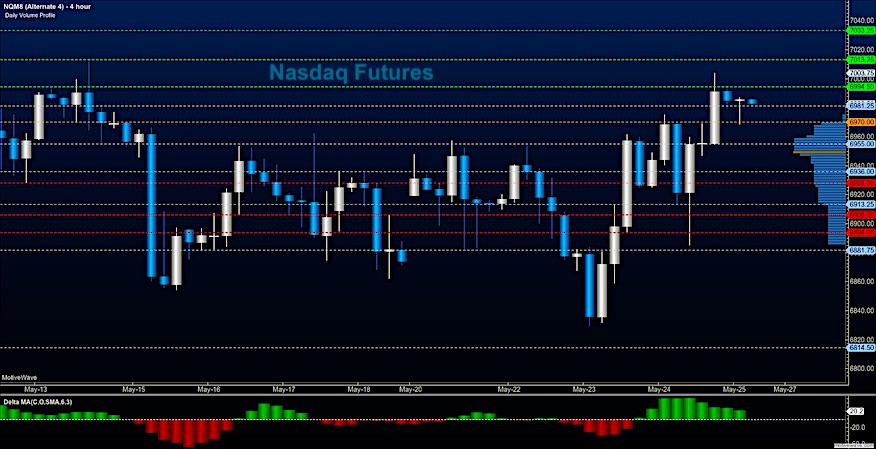
NASDAQ Futures
Traders piled in again at the tests of deeper support as they had the day before and a double top of sorts shows. Pullbacks seem shallower in today’s action as 6961 begins to firm up as higher early morning support. Failure to hold 6944 will spell trouble for buyers and intraday selling motion may catch hold. The bullets below represent the likely shift of trading momentum at the successful or failed retests at the levels noted.
- Buying pressure intraday will likely strengthen with a bullish retest of 6991.75
- Selling pressure intraday will likely strengthen with a bearish retest of 6961.5
- Resistance sits near 6994.5 to 7011.5 with 7023.5 and 7044.25 above that
- Support sits between 6972.75 and 6962.5, with 6928.75 and 6894.5 below that.
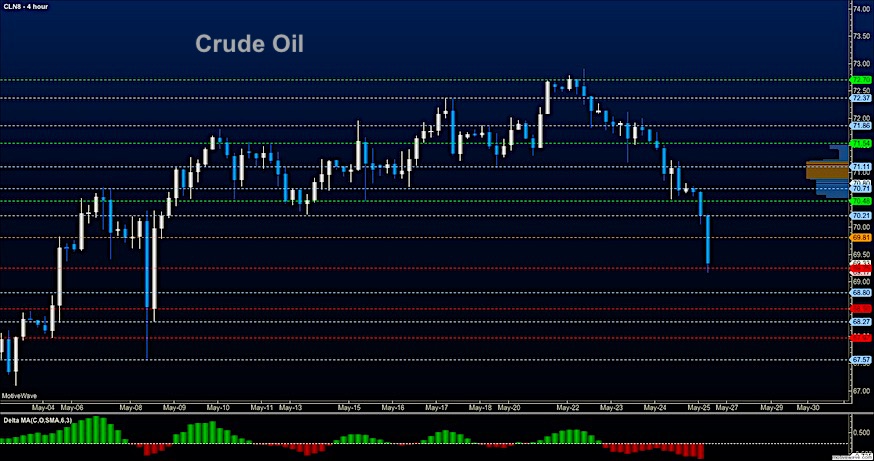
WTI Crude Oil
The weight of hedge funds selling this contract down shows particularly today. Bounces are still likely to fade into support but the selling has slowed near 69.25 where we see some buyers at old support regions. Because I suspect we are trimming long positions rather than building short ones, we could easily slip into congestion and initiate a new bounce pattern. I’m watching the edges to see if we can hold the spaces of support being tested here. The bullets below represent the likely shift of trading momentum at the successful or failed retests at the levels noted.
- Buying pressure intraday will likely strengthen with a bullish retest of 69.81
- Selling pressure intraday will strengthen with a bearish retest of 69.11
- Resistance sits near 69.58 to 70.21, with 70.81 and 71.14 above that.
- Support holds near 69.25 to 68.89, with 68.54 and 67.97 below that.
Twitter: @AnneMarieTrades
The author trades stock market futures every day and may have a position in mentioned securities at the time of publication. Any opinions expressed herein are solely those of the author, and do not in any way represent the views or opinions of any other person or entity.
")


