Stock Market Outlook for January 9, 2017 –
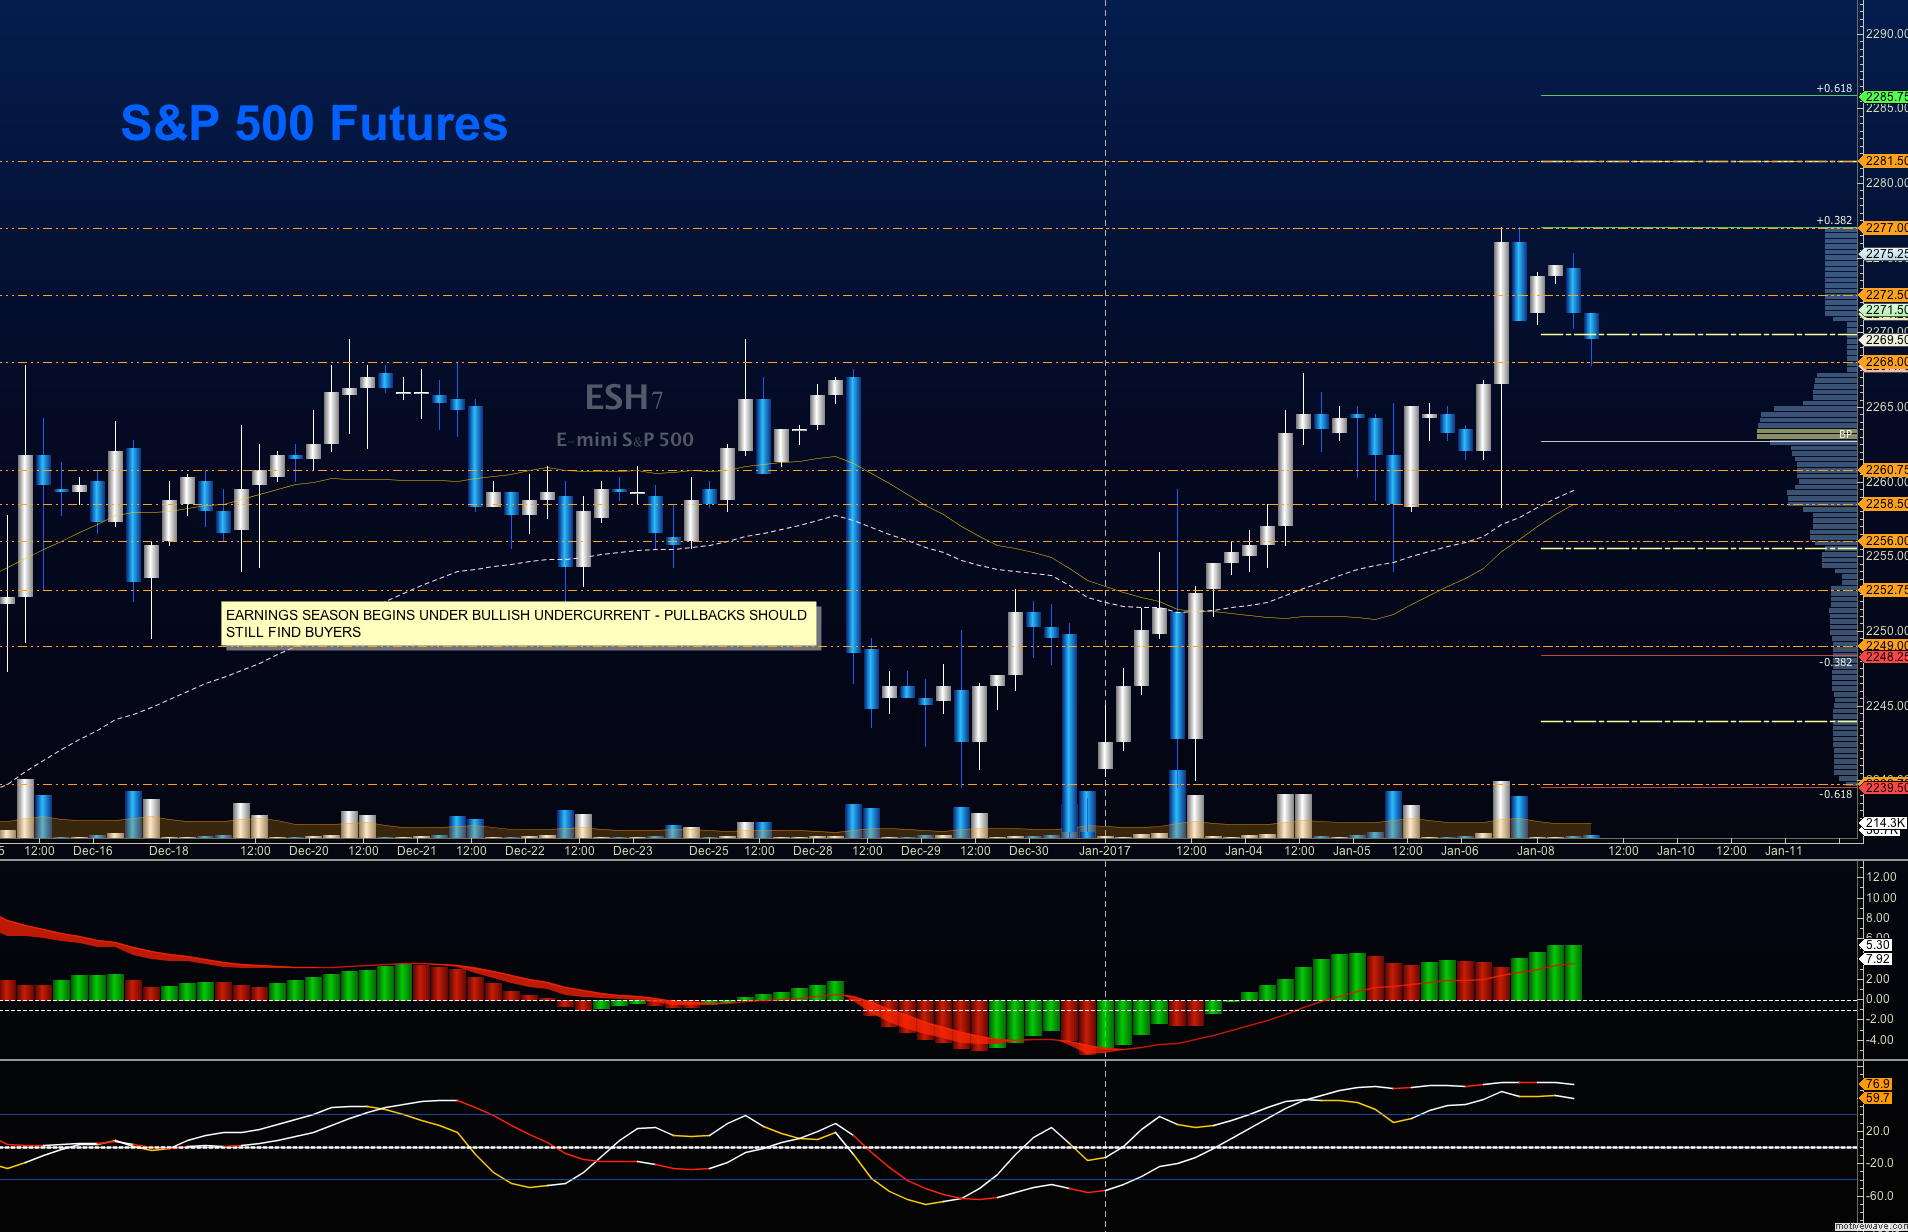
After posting new highs, the chart for the S&P 500 (INDEXSP:.INX) has retreated but is still holding above a key breakout level – 2268 on futures. The trend is still bullish meaning the bounces off support are likely to hold. Earnings releases will begin this week and after a continued lift in the first week, traders will slow a bit as they wait out the releases.
Buying pressure will likely strengthen above 2273 on S&P 500 futures, but I suspect limited upside today. Selling pressure will strengthen with a failed retest of 2260.50. Resistance sits near 2274.75 to 2277.25, with 2280.75 and 2282.5 above that. Price support holds between 2257- 2254 with a failed test of 2260.50.
See today’s economic calendar with a rundown of releases.
TODAY’S RANGE OF MOTION
E-mini S&P 500 Futures Trading Chart For January 9
Upside trades – Two options for entry–
Positive retest of continuation level -2271.75
Positive retest of support level– 2264.25
Opening targets ranges – 2268.25, 2271.25, 2272.75, 2275.50, 2277, 2280.25, 2282.50, and 2285.25
Downside trades – Two options for entry–
Failed retest of resistance level -2274.50 (watch for higher support building)
Failed retest of support level– 2264 (Watch for 2260.50 to potentially provide buying pressure)
Opening target ranges – 2270.75, 2268, 2264.75, 2260.50, 2258.75, 2255.75, 2252.75, 2249.75, 2246.50, 2242.75, and 2239.
Nasdaq Futures
The NQ_F rocketed higher as managers put money to work in the most liquid of tech. So far, we are holding the breakout level of 5002 into the release of earnings beginning for the first quarter. Pullbacks should be bought in the current formation, however, I will be watching for the failed test of 5002 for a test of the real breakout near 4978.50. Buyers seem quite determined to create higher lows at this time, so a retest of 4994 might be the most we see in a pullback.
Buying pressure will likely strengthen above 5015, but upside seems limited
Selling pressure will strengthen with a failed retest of 4994, but shorts are very countertrend today. Resistance sits near 5012.75 to 5017, with 5020.75 and 5032.50 above that. Support holds between 4994 and 4985.50 with a failed test of 5002.50.
Upside trades – Two options
Positive retest of continuation level -5012 (needs confirmation on tight time frame)
Positive retest of support level– 4994.75
Opening target ranges – 4997, 5002.25, 5006.25, 5011.75, 5017, 5020.75, 5024.75, 5027.75, and 5032.50
Downside trades- Two options
Failed retest of resistance level – 5020.75(lower highs must have presented first)
Failed retest of support level– 5002 (watch for buyers near 4997 and 4994)
Opening target ranges – 5017, 5011.75, 5009, 5004.25, 4997.75, 4994.75, 4991.50, 4985.50, 4978.75, 4972.25, 4968.75, 4964.50, 4960.25, 4955.75, 4954.5, 4949.25, 4945.75, 4941, and 4937.75
Oil –WTI Crude
We are in a jagged range bound space. Buying pressure will likely strengthen above 53.84 in the current formation, though neutral momentum may be telegraphing a failure to hold a breakout.
Selling pressure will strengthen with a failed retest of 53.03, but buyers may hold 52.82. Resistance sits near 54.28 to 54.76, with 54.9 and 55.3 above that. Support holds between 52.5 and 52.34 with a failed test of 53.03.
Upside trades – Two options
Positive retest of continuation level -53.45 (needs confirmation)
Positive retest of support level– 53.03
Opening target ranges – 53.23, 53.45, 53.82, 54.12, 54.35, 54.51, 54.73, 55.06, 55.24, 55.34, 55.7, 56.05, and 56.5
Downside trades- Two options
Failed retest of resistance level – 53.43 (watch for higher lows to stop process down)
Failed retest of support level – 53 (watch support near 52.83 if higher lows present themselves)
Opening target ranges – 53.23, 53.03, 52.78, 52.51, 52.32, 52.12, 51.82, 51.56, 51.3, and 51.12
If you’re interested in watching these trades go live, join us in the live trading room from 9am to 11:30am each trading day.
Visit TheTradingBook for more information.
If you’re interested in the live trading room, it is now primarily stock market futures content, though we do track heavily traded stocks and their likely daily trajectories as well – we begin at 9am with a morning report and likely chart movements along with trade setups for the day.
As long as the trader keeps himself aware of support and resistance levels, risk can be very adequately managed to play in either direction as bottom picking remains a behavior pattern that is developing with value buyers and speculative traders.
Twitter: @AnneMarieTrades
The author trades stock market futures every day and may have a position in mentioned securities at the time of publication. Any opinions expressed herein are solely those of the author, and do not in any way represent the views or opinions of any other person or entity.

: Showing Some Signs of Emerging Strength")

