S&P 500 Futures (ES) Considerations For March 28, 2017
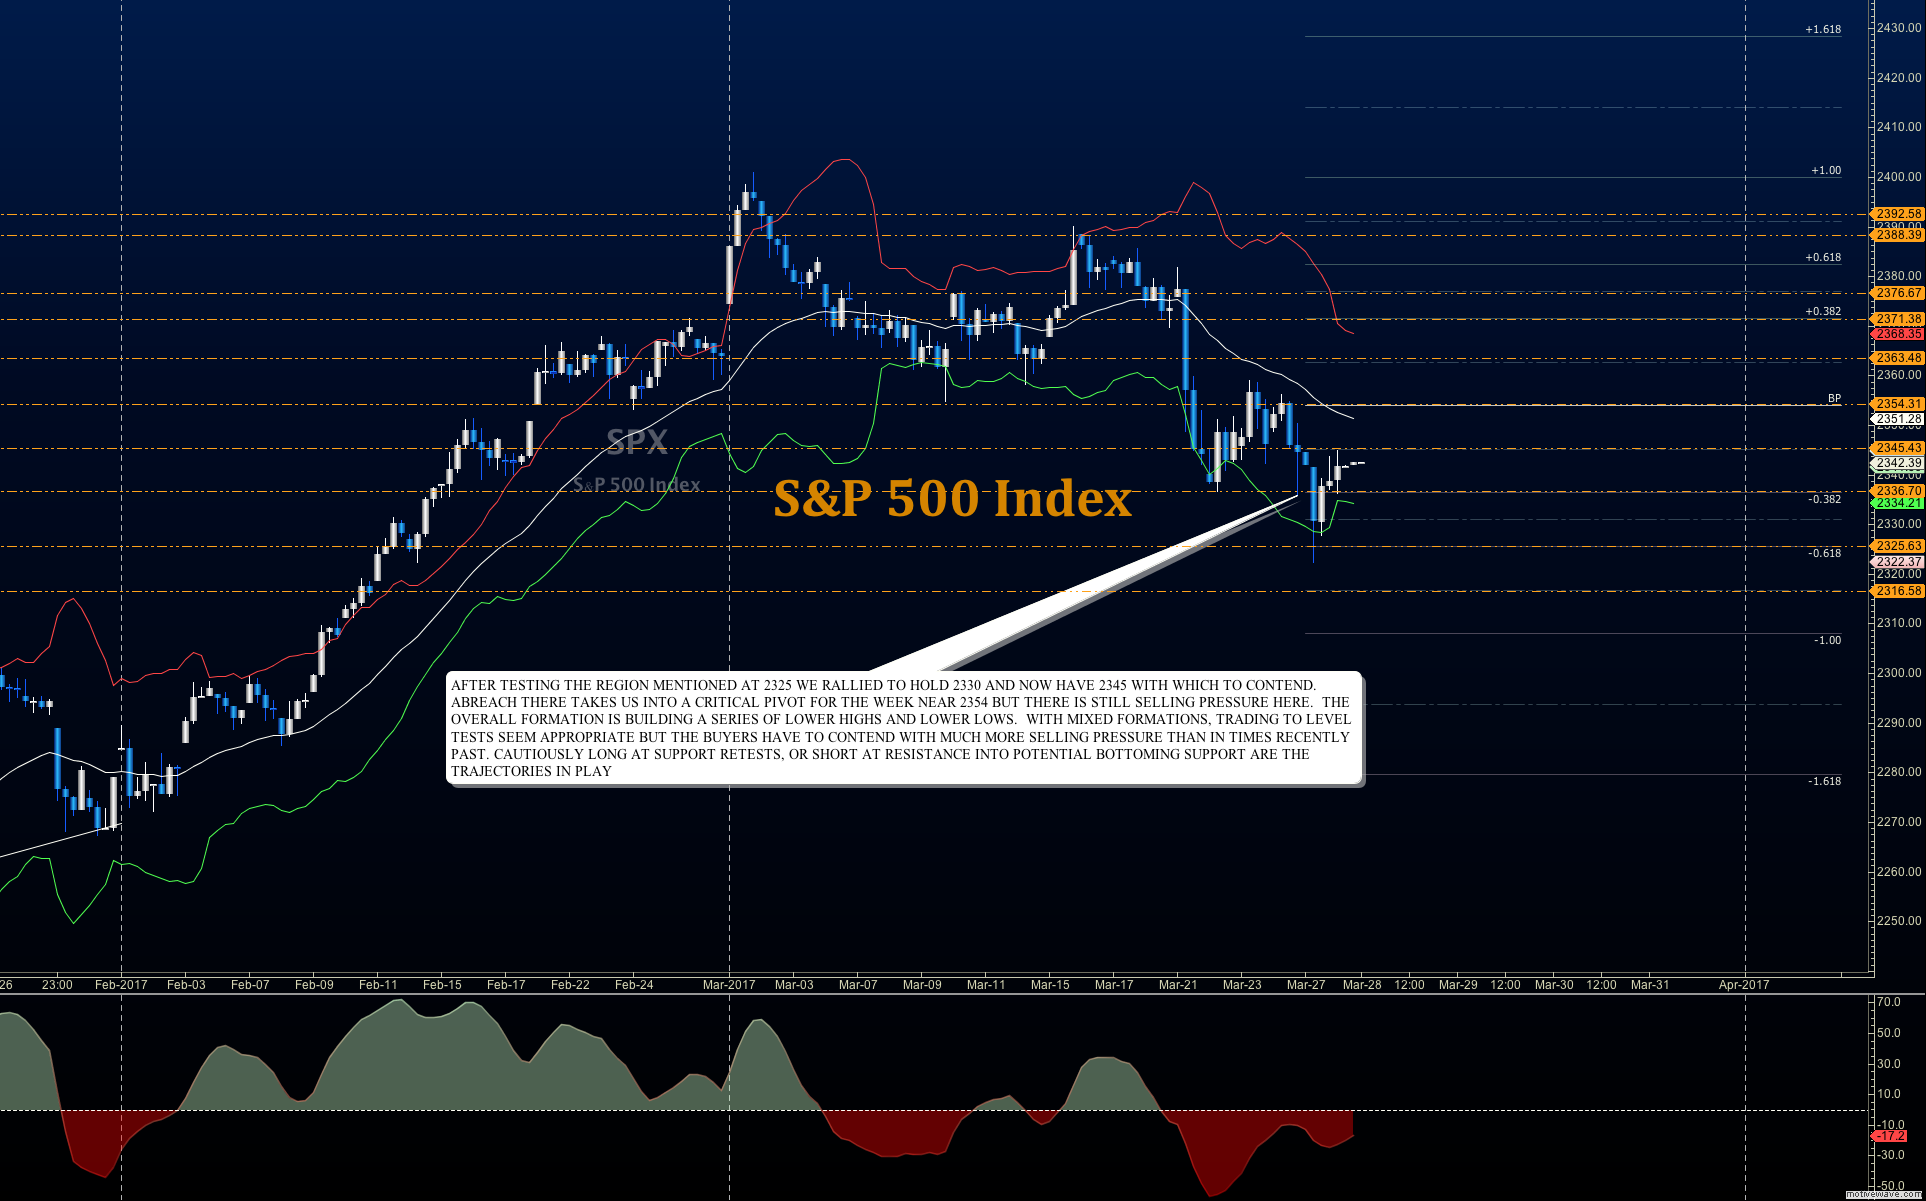
After a bottoming process early in the day yesterday, the S&P 500 Index (INDEXSP:.INX) rallied nicely to fill the gap created by the downward open of the charts. After filling the gap in the overnight session, we have begun a fade into key support for the week here around 2336 (on futures).
Check out today’s economic calendar with a full rundown of releases. And note that the charts below are from our premium service and shared exclusively with See It Market readers.
We should see some sort of battle here as this region is visible as support on weekly candlesticks. The failure to breach 2344 or the loss of 2332 could signal further movement in the direction of the break. Momentum is mixed so I suspect some measure of choppy action that is likely to bring higher lows our way. Big support levels to watch beneath 2332 are 2330 and 2324.
Key Price Levels and Trading Insights
- Buying pressure will likely strengthen above a positive retest of 2344.5
- Selling pressure will likely strengthen with a failed retest of 2323
- Resistance sits near 2342.5 to 2344.5, with 2348.5 and 2354.25 above that
- Support holds between 2323.5 and 2317.5, with 2311.5 and 2305.5 below that
NASDAQ Futures (NQ)
After bouncing nicely into resistance near 5395, traders have pushed this chart lower where it now tests the first line of higher lows at 5375. Sellers will challenged here to break through this region as it was a support zone, but if momentum carries through we’ll see the move back to 5370 and lower if momentum strengthens.
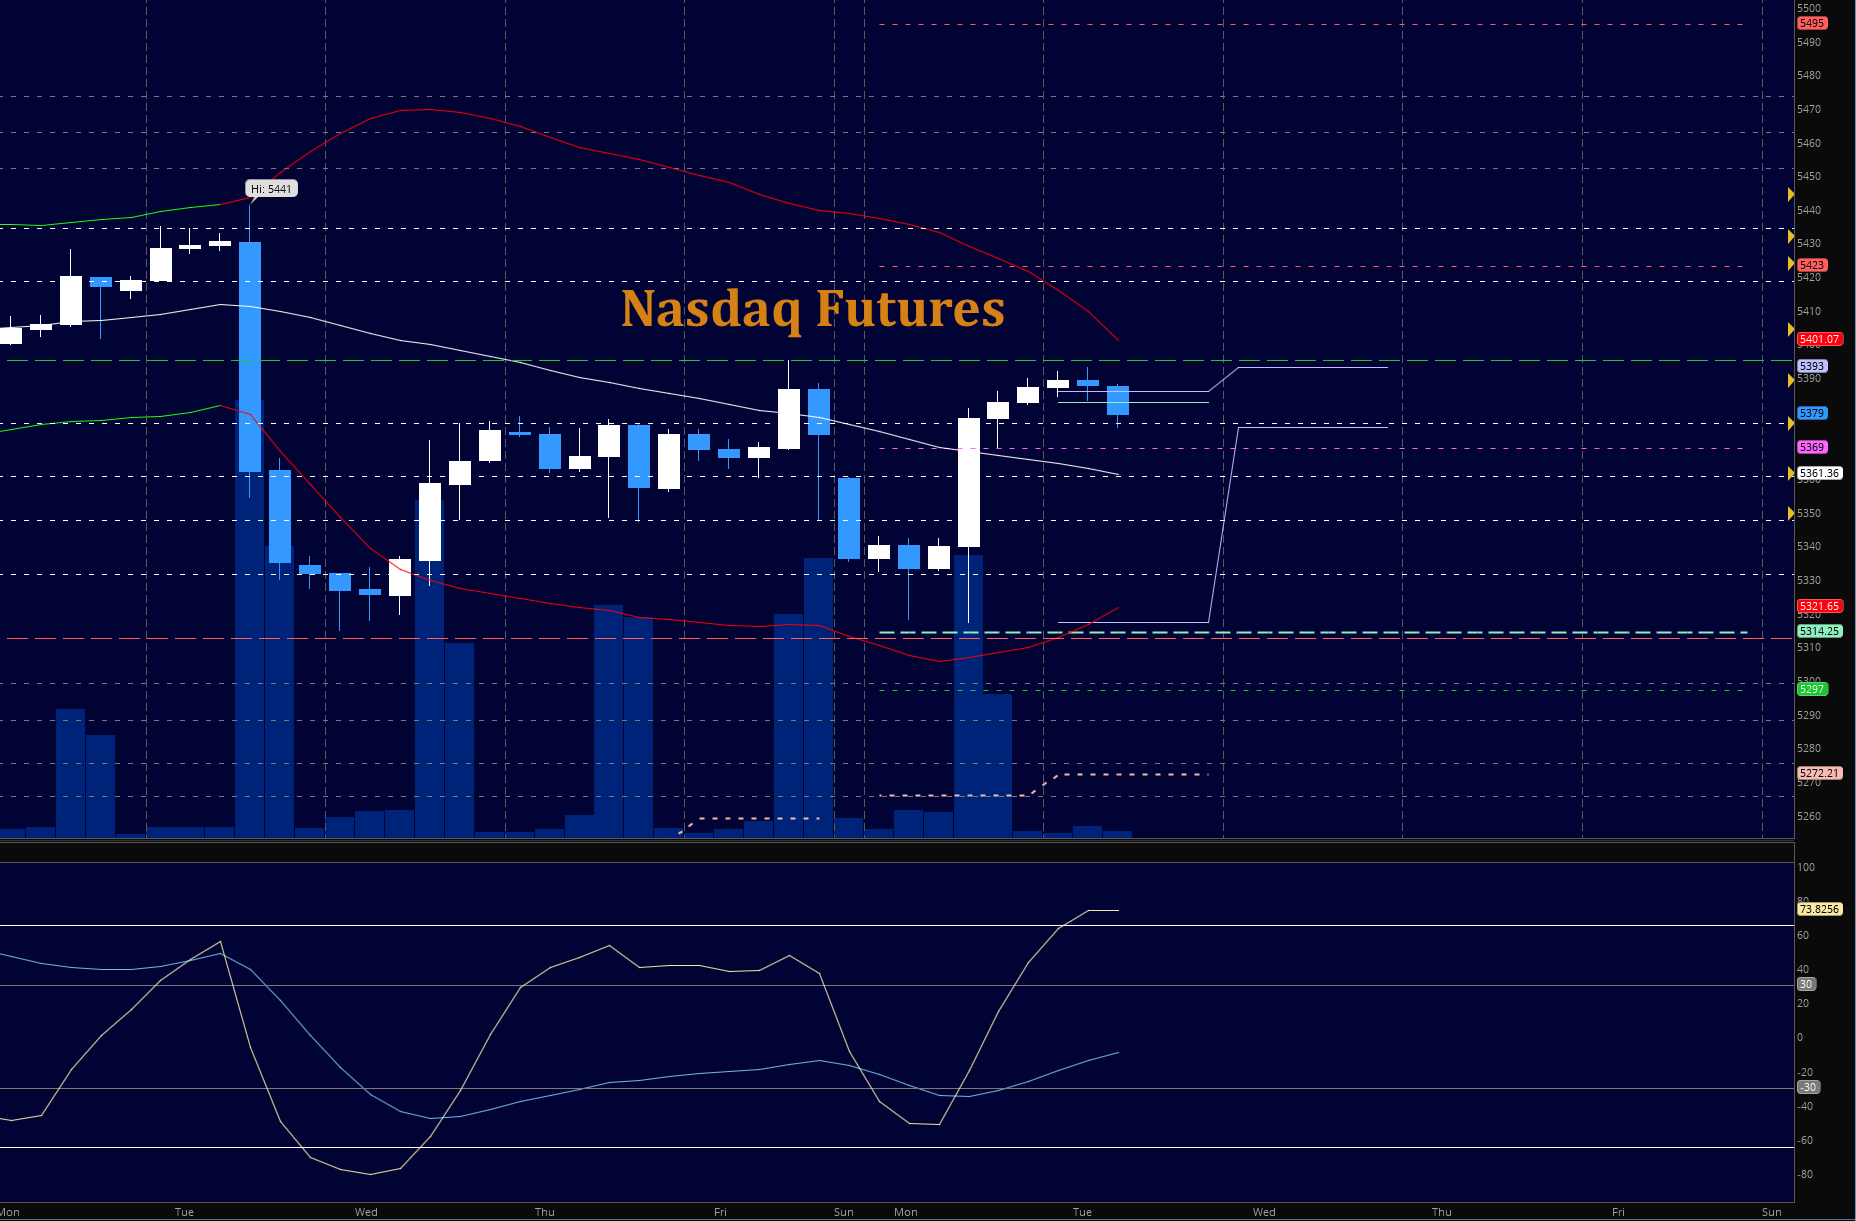
Key Price Levels and Trading Insights:
- Buying pressure will likely strengthen with a positive retest of 5385.5 (use caution-wait for a retest)
- Selling pressure will likely strengthen with a failed retest of 5369.25
- Resistance sits near 5385.5 to 5395.5, with 5405.5 and 5415.5 above that
- Support holds between 5360.25 and 5347, with 5331 and 5299.25 below that
CRUDE OIL –WTI
With the API and EIA reports still ahead this week for release, oil is attempting to bounce off support levels and has approached a key area of resistance near 48.2. There is enough pressure here to push the chart through this region and into 48.54, it seems. We are range bound between 47.2 and 48.55 and momentum suggests that if we do press above 48.6, we will be unable to sustain the motion without a fade.
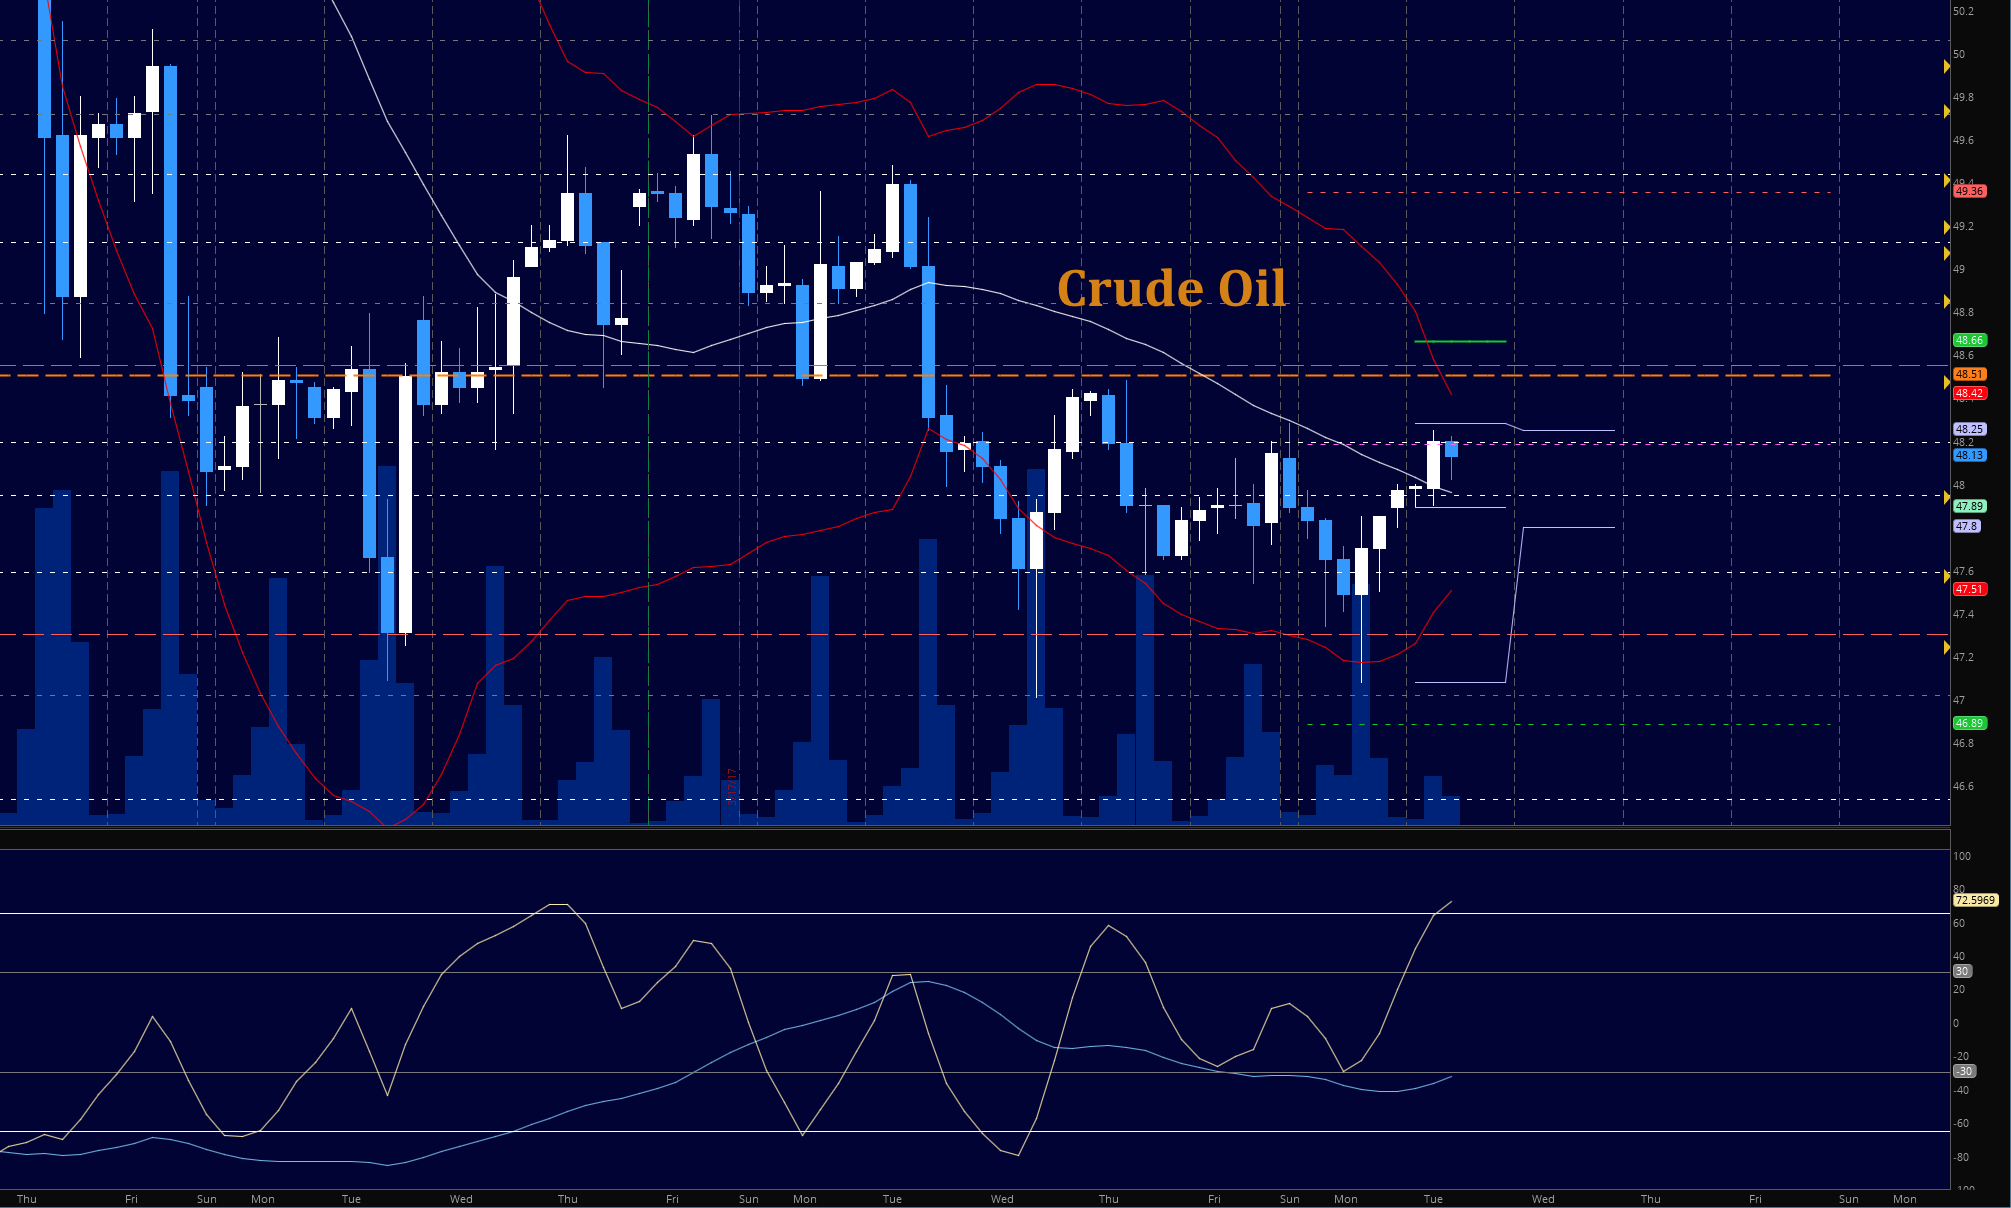
Key Price Levels and Trading Insights:
- Buying pressure will likely strengthen with a positive retest of 48.55 (be careful here)
- Selling pressure will strengthen with a failed retest of 47.74
- Resistance sits near 48.3 to 48.54, with 48.84 and 49.25 above that.
- Support holds between 47.25 and 47.01, with 46.86 and 46.53 below that.
If you’re interested in the live trading room, it is now primarily stock market futures content, though we do track heavily traded stocks and their likely daily trajectories as well – we begin at 9am with a morning report and likely chart movements along with trade setups for the day.
As long as the trader keeps himself aware of support and resistance levels, risk can be very adequately managed to play in either direction as bottom picking remains a behavior pattern that is developing with value buyers and speculative traders.
Twitter: @AnneMarieTrades
The author trades stock market futures every day and may have a position in mentioned securities at the time of publication. Any opinions expressed herein are solely those of the author, and do not in any way represent the views or opinions of any other person or entity.


