Stock Market Futures Considerations For July 28, 2017
The S&P 500 Index (INDEXSP:.INX) got a jolt yesterday as lower support levels were tested. With futures trading lower this morning, a retest appears to be in order. Careful. See full futures trading levels for the S&P 500, Nasdaq, and crude oil below.
Check out today’s economic calendar with a full rundown of releases. And note that the charts below are from our premium service and shared exclusively with See It Market readers.
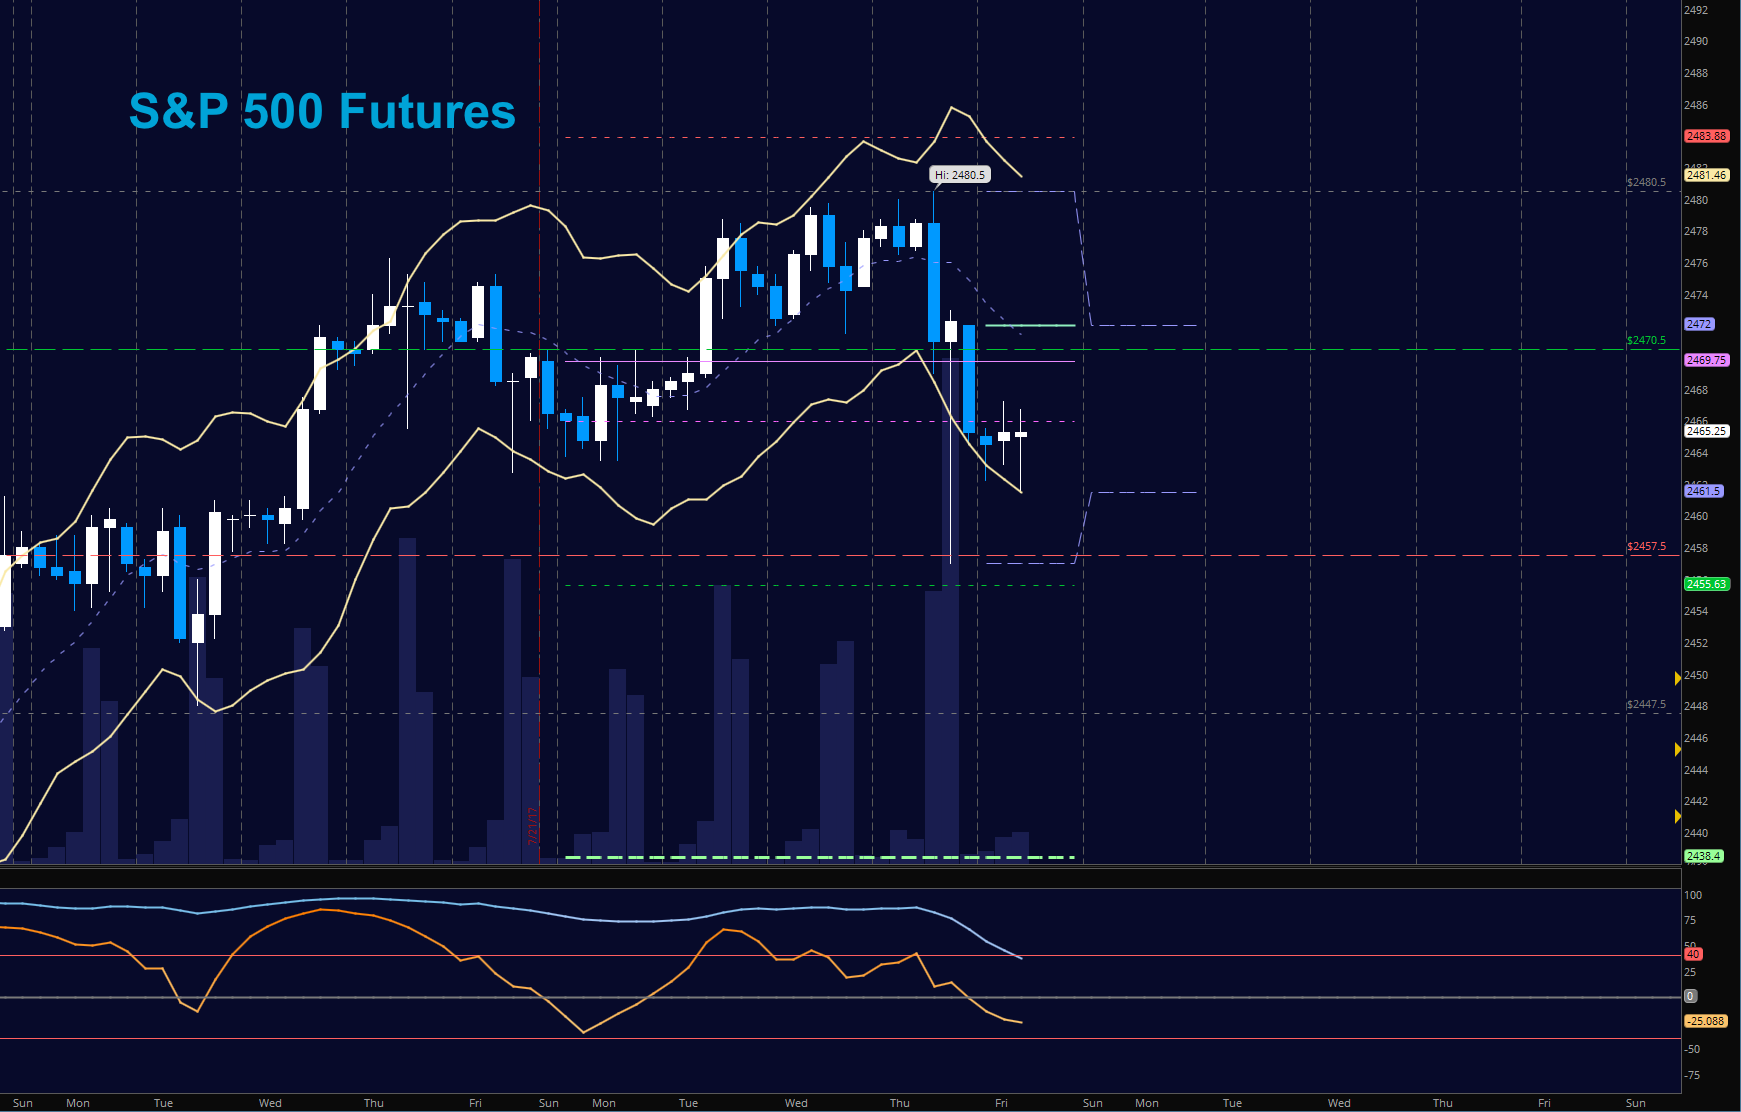
S&P 500 Futures (ES)
A retrace into weekly support was blamed on a miss by Amazon, but was likely amplified by algorithmic momentum following systems. Gaps down greet us at the open today and a failed bounce into lower highs is my supposition for the day today. New highs in the early market hours as earnings continue to be released. Support to hold today to keep us from heading lower is 2457. Resistance is old support at 2470. The bullets below represent the likely shift of trading momentum at the positive or failed retests at the levels noted.
- Buying pressure intradaywill likely strengthen above a positive retest of 2470 (careful again here with resistance)
- Sellingpressure intraday will likely strengthen with a failed retest of 2460.5
- Resistance sits near 2472.5 to 2474.5, with 2476.75 and 2481.75 above that
- Support holds between 2457.5 and 2454.5, with 2451.5 and 2447.5 below that.
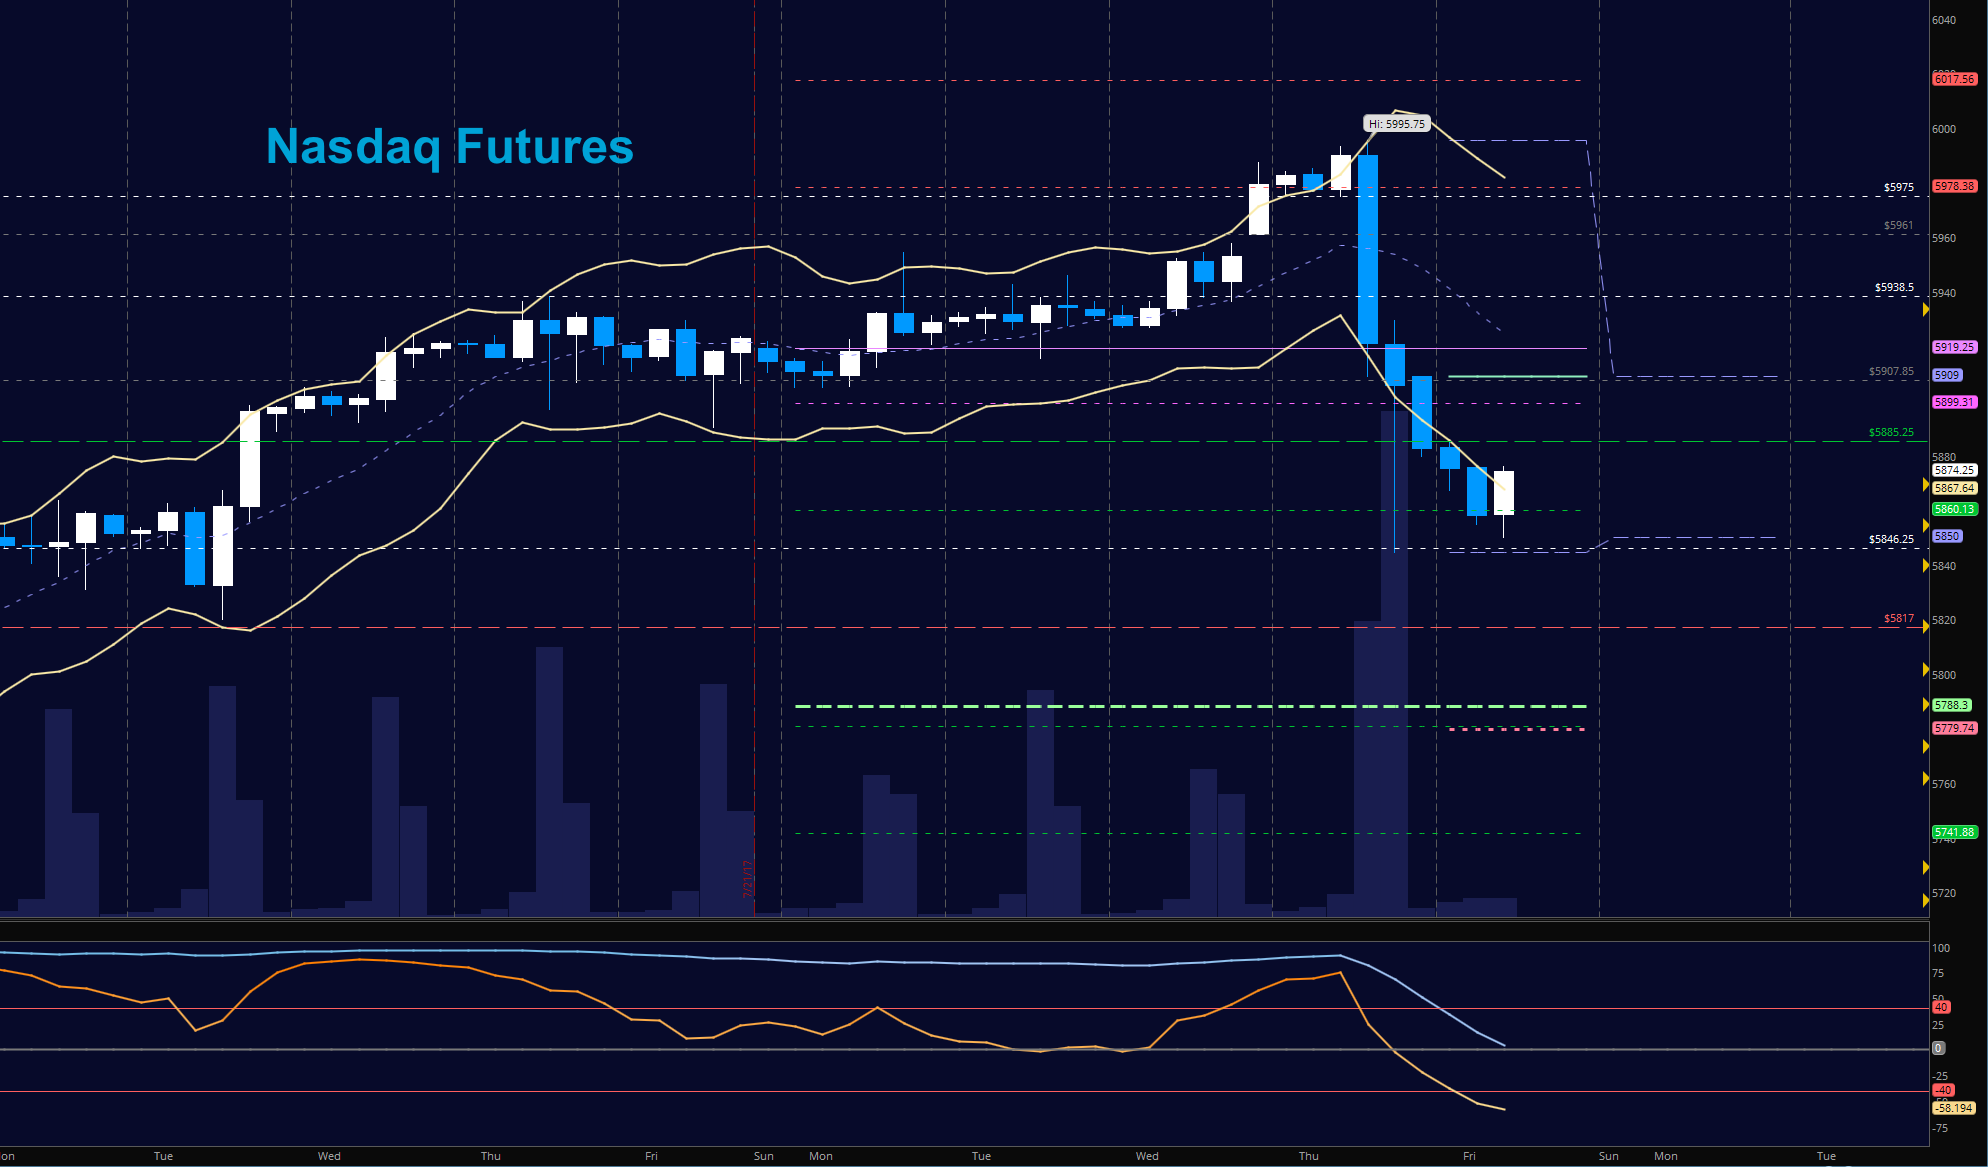
NASDAQ Futures (NQ)
A move of more than 150 points – 600 ticks of motion – from high to low yesterday gave traders quite a jolt. Traders are trying to hold the support regions near 5857 and in times past, they have been rewarded with buying the dip. Today we will likely see a lower high and a rejection at old support near 5907 to 5916. Momentum is negative. The bullets below represent the likely shift of intraday trading momentum at the positive or failed tests at the levels noted.
- Buyingpressure intraday will likely strengthen with a positive retest of 5897.5
- Sellingpressure intraday will likely strengthen with a failed retest of 5846
- Resistance sits near 5907.5 to 5916.5, with 5936.75 and 5961.75 above that.
- Support holds between 5844.5 and 5833.5, with 5824.5 and 5808.5 below that.
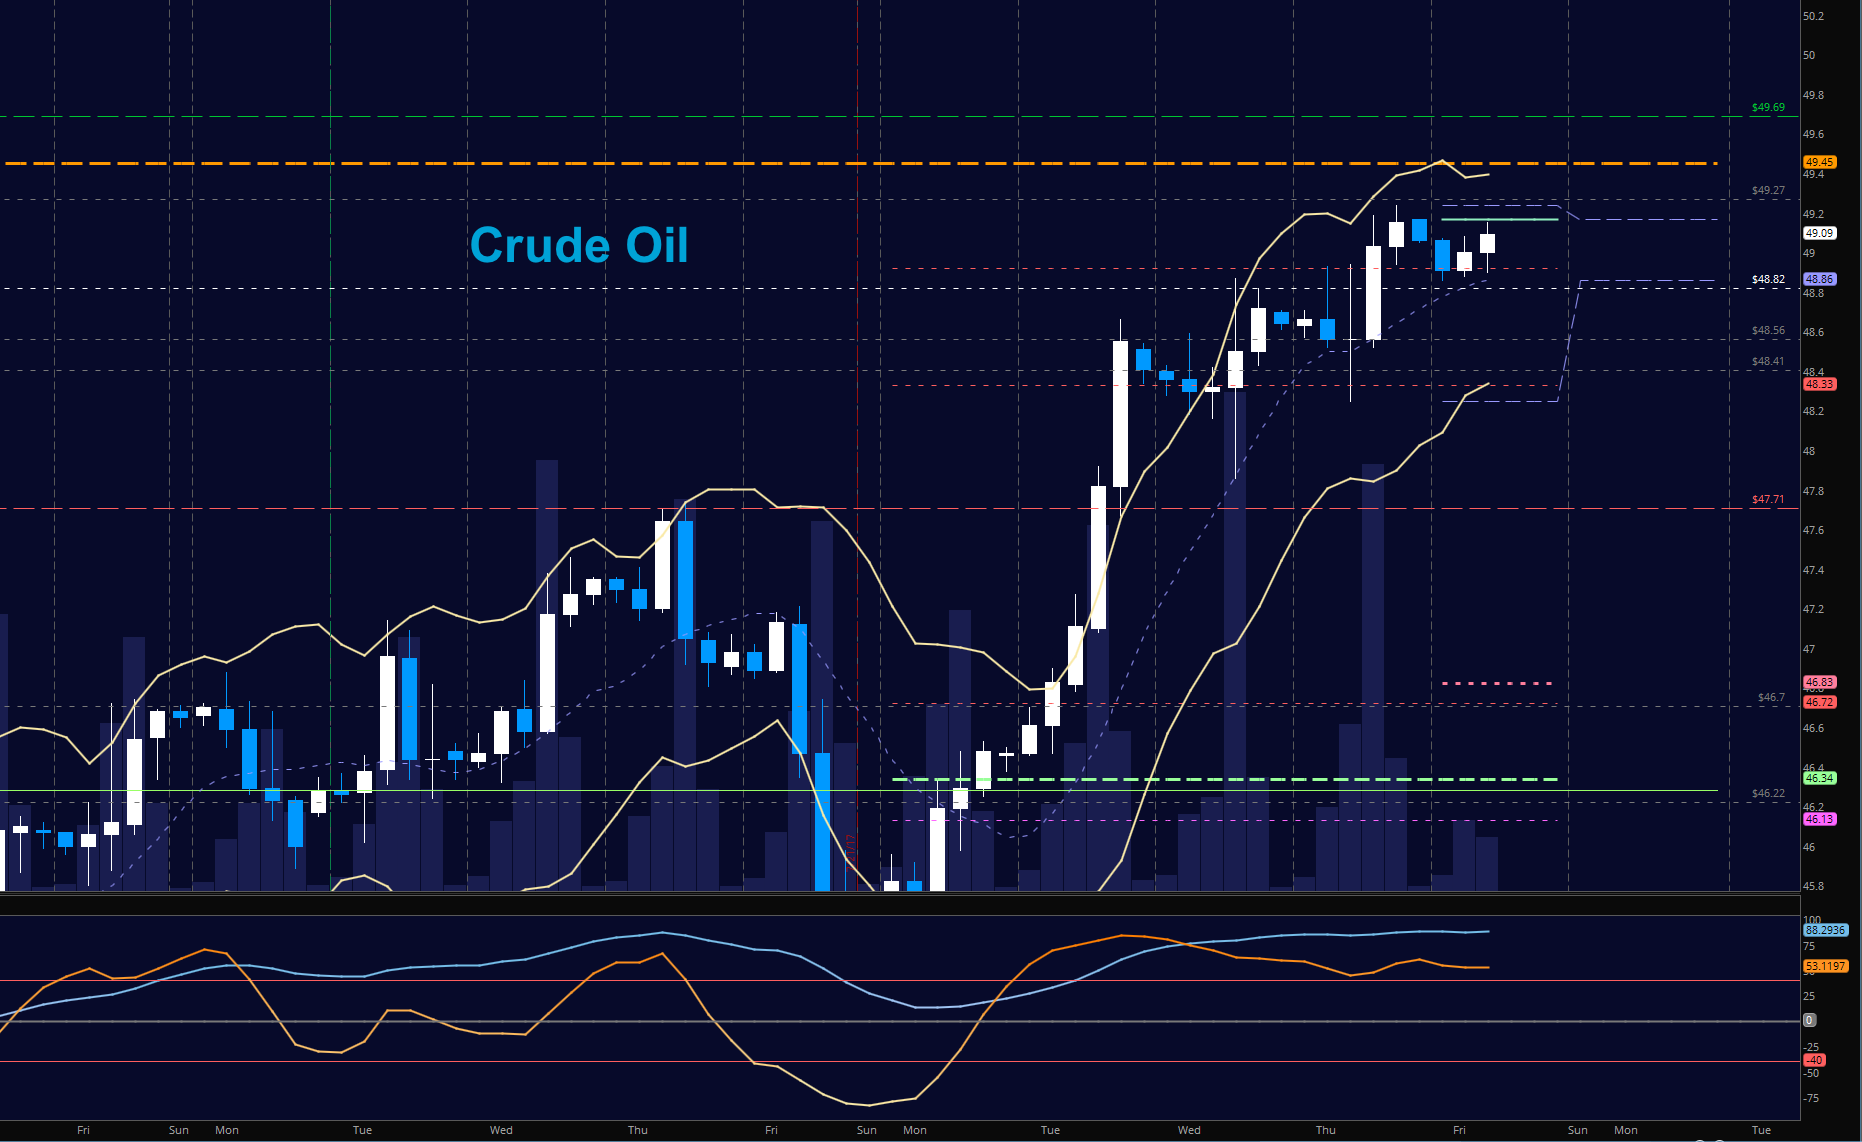
WTI Crude Oil
Bullish formations still hold here with the support zone to watch being 48.82. Pullbacks will continue to hold regions for buyers to engage. Above 49.18, we see 49.26 to 49.59 as the next test area. The bullets below represent the likely shift of trading momentum at the positive or failed tests at the levels noted.
- Buyingpressure intraday will likely strengthen with a positive retest of 48.94
- Sellingpressure intraday will strengthen with a failed retest of 48.24
- Resistance sits near 48.94 to 49.17, with 49.38 and 49.64 above that.
- Support holds between 48.01 to 47.86, with 47.45 and 46.88 below that.
If you’re interested in watching these trades go live, join us in the live trading room from 9am to 11:30am each trading day. Visit TheTradingBook for more information.
If you’re interested in the live trading room, it is now primarily stock market futures content, though we do track heavily traded stocks and their likely daily trajectories as well – we begin at 9am with a morning report and likely chart movements along with trade setups for the day.
As long as the trader keeps himself aware of support and resistance levels, risk can be very adequately managed to play in either direction as bottom picking remains a behavior pattern that is developing with value buyers and speculative traders.
Twitter: @AnneMarieTrades
The author trades stock market futures every day and may have a position in mentioned securities at the time of publication. Any opinions expressed herein are solely those of the author, and do not in any way represent the views or opinions of any other person or entity.


