Stock Market Futures Considerations For July 25, 2017
The S&P 500 (INDEXSP:.INX) is pointing higher and trying to push through key resistance levels. A key toggle for S&P 500 futures will be 2474.75. More levels across the futures markets are highlighted below.
Check out today’s economic calendar with a full rundown of releases. And note that the charts below are from our premium service and shared exclusively with See It Market readers.
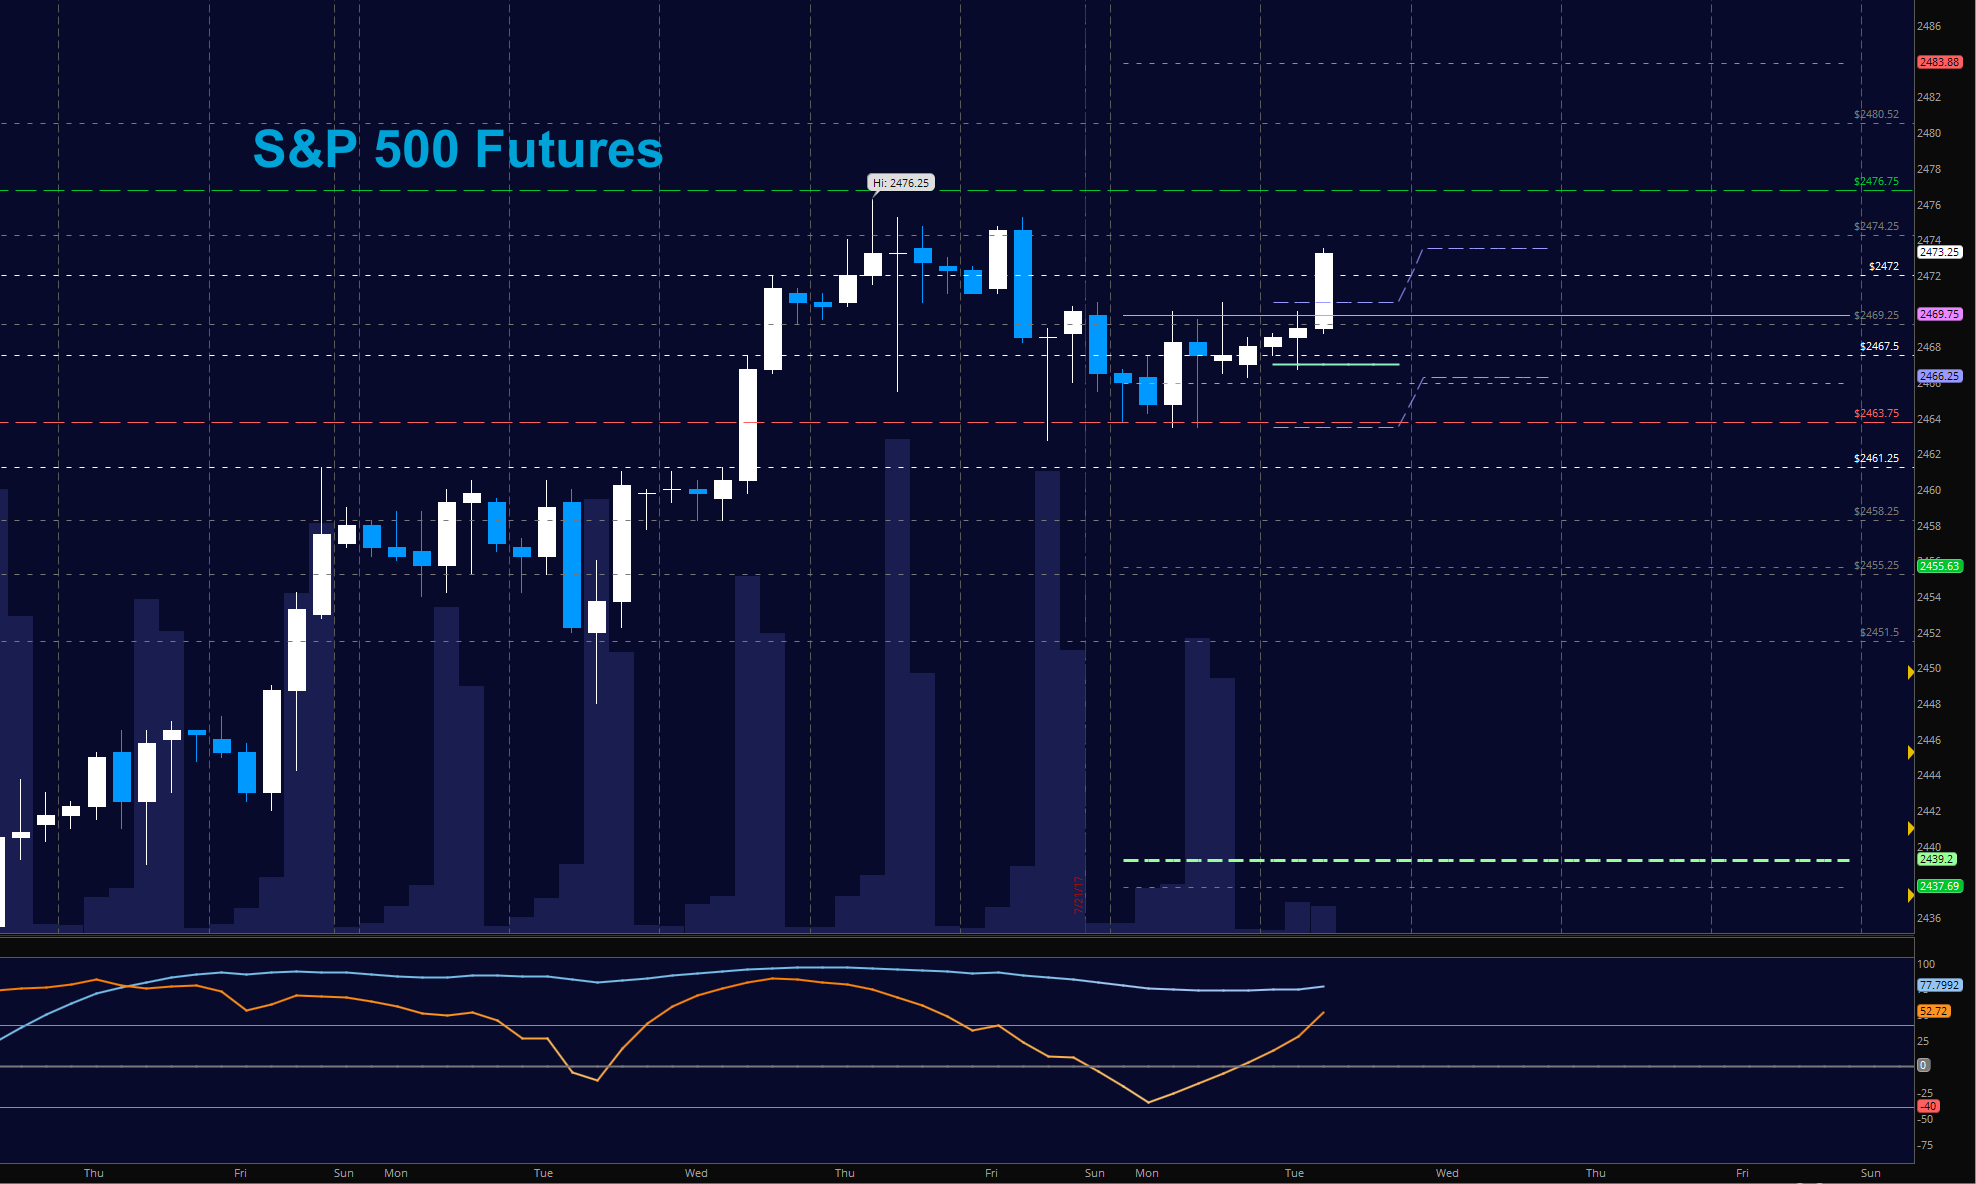
S&P 500 Futures (ES)
Buyers are forcing us into tests of new highs ahead as the undercurrent of bullish action holds steady. Support levels are higher and begin near 2465.25. A failed retest there will bring us more intraday selling into deeper support. First pass tests, however, will bring buyers. If we fail to breach highs, it will signal that sellers still command supply. The bullets below represent the likely shift of trading momentum at the positive or failed retests at the levels noted.
- Buying pressure intraday will likely strengthen above a positive retest of 2474.75 (careful again here with resistance)
- Selling pressure intraday will likely strengthen with a failed retest of 2466
- Resistance sits near 2474.5 to 2476.75, with 2480.75 and 2483.75 above that.
- Support holds between 2466.5 and 2461.5, with 2457.25 and 2452.5 below that.
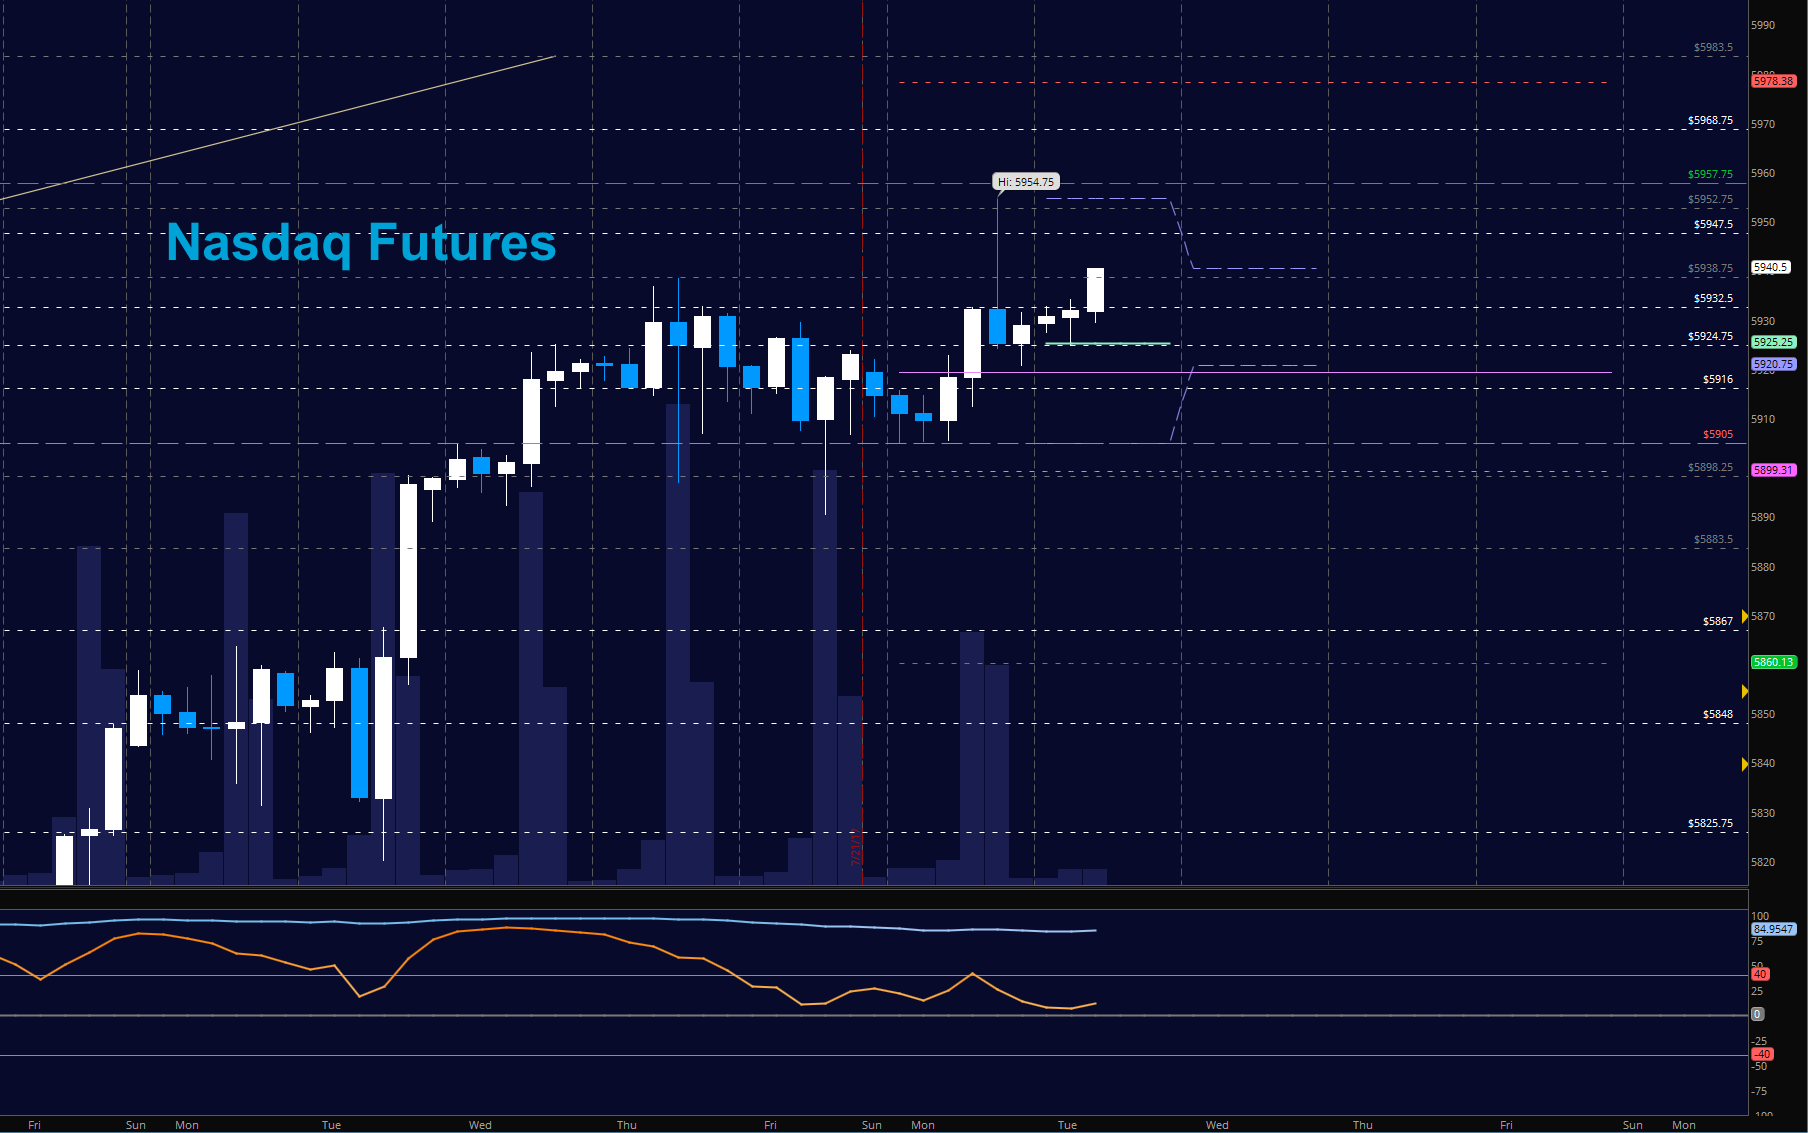
NASDAQ Futures (NQ)
Buyers firmed up higher support at 5915 yesterday and we are now in a breach above congestion near 5932.5. Above 5932.5, buyers have control of price action. Below that level, it becomes a bit more of a mixed bag. Formations still suggest that breakouts are likely to fade after first targets are achieved, and pullbacks are likely to be bought at solid support tests. The bullets below represent the likely shift of intraday trading momentum at the positive or failed tests at the levels noted.
- Buying pressure intraday will likely strengthen with a positive retest of 5932.5
- Selling pressure intraday will likely strengthen with a failed retest of 5915
- Resistance sits near 5832.5 to 5942.5, with 5947.75 and 5957.75 above that.
- Support holds between 5915.75 and 5907.75, with 5889.5 and 5867.5 below that.
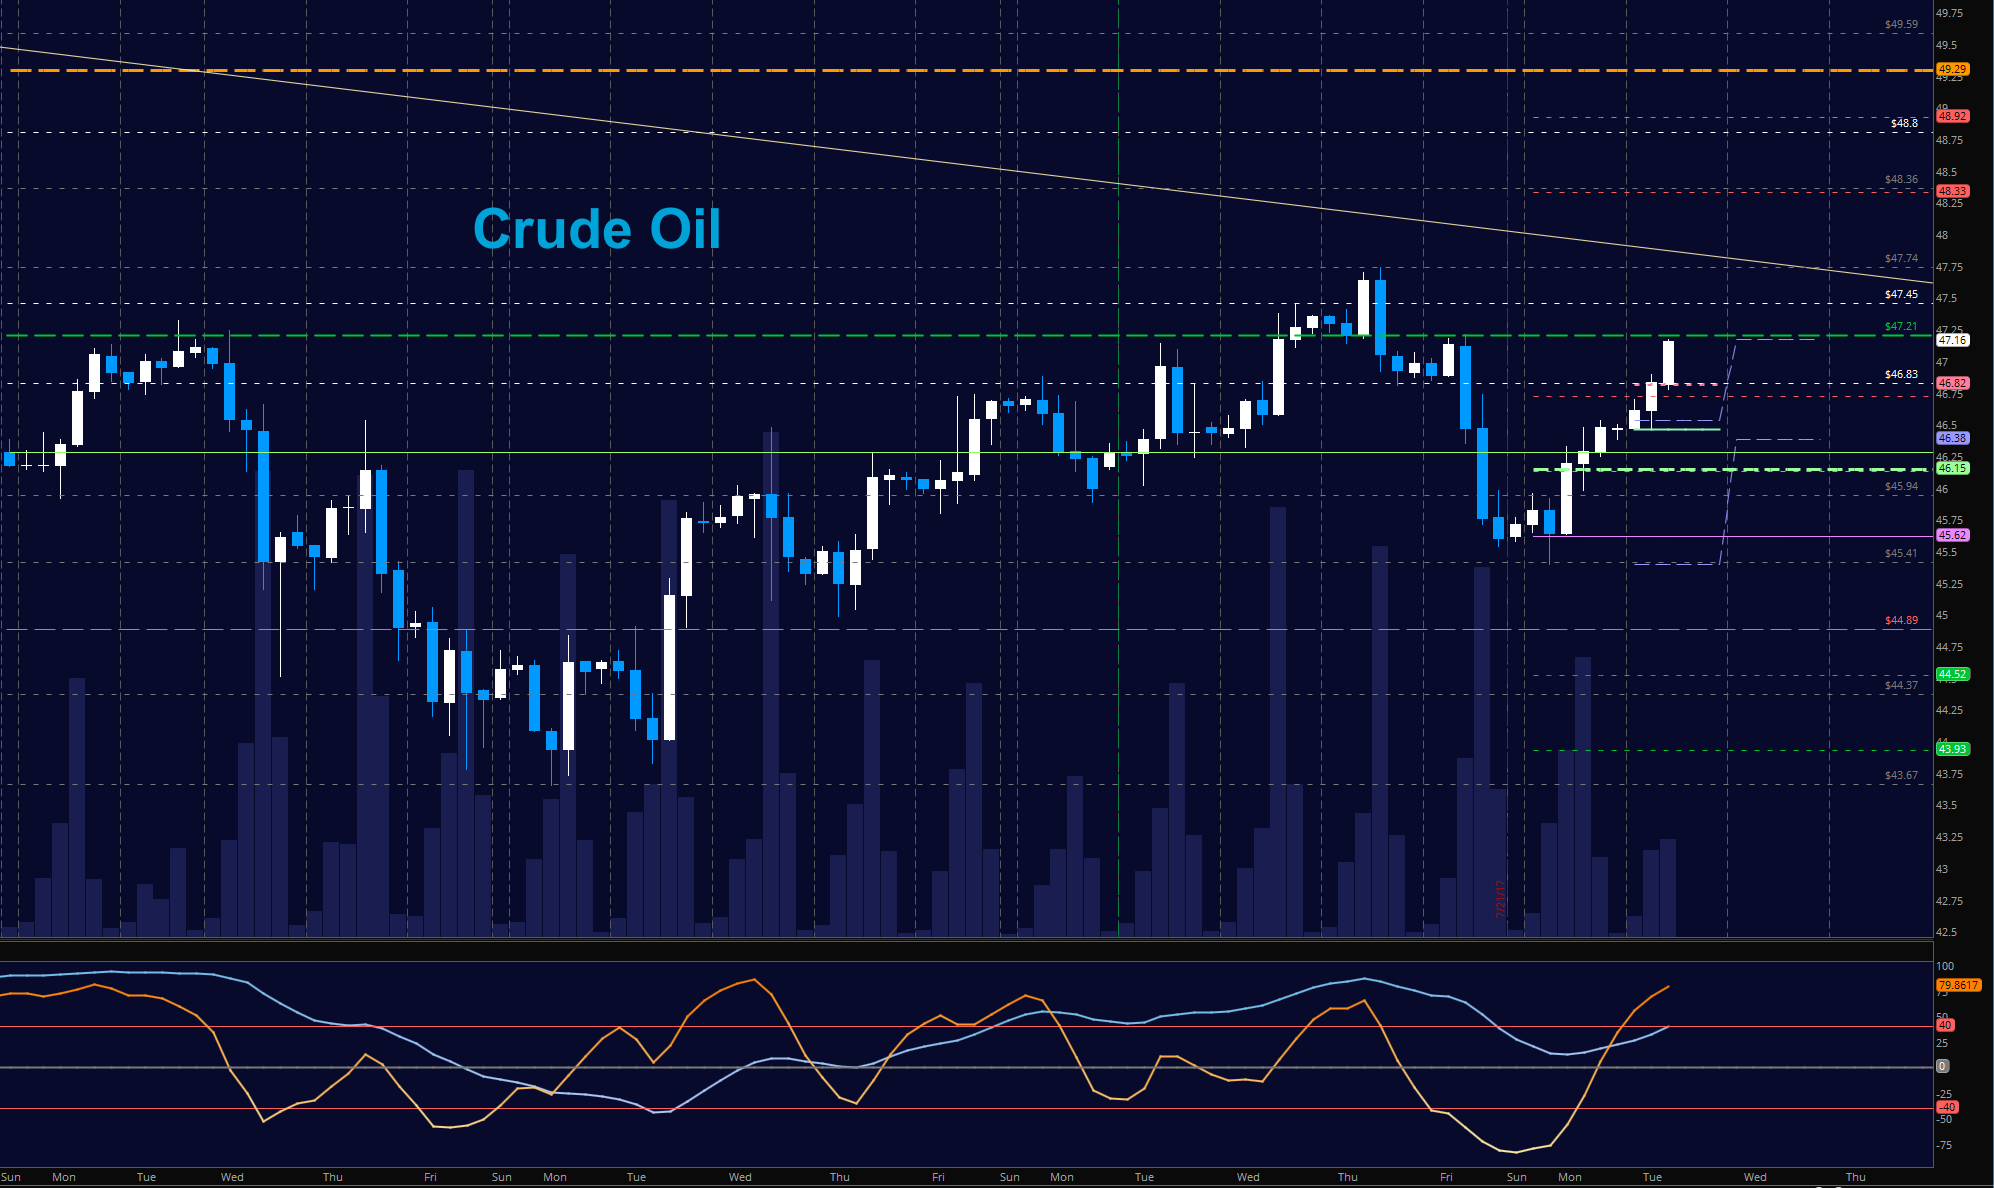
WTI Crude Oil
API report after the close. Buyers have reclaimed pressure as we test old resistance near 47.2. Momentum is now bullish suggesting that pullbacks will continue to hold regions for buyers to engage. Support levels are now at the 46.1 while selling pressure is present near 47.2. A breach here would be quite bullish for the chart and I anticipate would force us into levels above 48 for the first time in a while. The bullets below represent the likely shift of trading momentum at the positive or failed tests at the levels noted.
- Buying pressure intraday will likely strengthen with a positive retest of 47.3
- Selling pressure intraday will strengthen with a failed retest of 46.38
- Resistance sits near 47.3 to 47.74, with 48.3 and 48.8 above that
- Support holds between 46.38 to 46.1, with 45.62 and 44.9 below that.
If you’re interested in the live trading room, it is now primarily stock market futures content, though we do track heavily traded stocks and their likely daily trajectories as well – we begin at 9am with a morning report and likely chart movements along with trade setups for the day.
As long as the trader keeps himself aware of support and resistance levels, risk can be very adequately managed to play in either direction as bottom picking remains a behavior pattern that is developing with value buyers and speculative traders.
Twitter: @AnneMarieTrades
The author trades stock market futures every day and may have a position in mentioned securities at the time of publication. Any opinions expressed herein are solely those of the author, and do not in any way represent the views or opinions of any other person or entity.


