Stock Market Futures Considerations For July 17, 2017
The S&P 500 (INDEXSP:.INX) is trading mixed on Monday morning, as traders pause to see what’s next following last week’s rally. See key trading levels below for the S&P 500, Nasdaq, and crude oil.
Check out today’s economic calendar with a full rundown of releases. And note that the charts below are from our premium service and shared exclusively with See It Market readers.
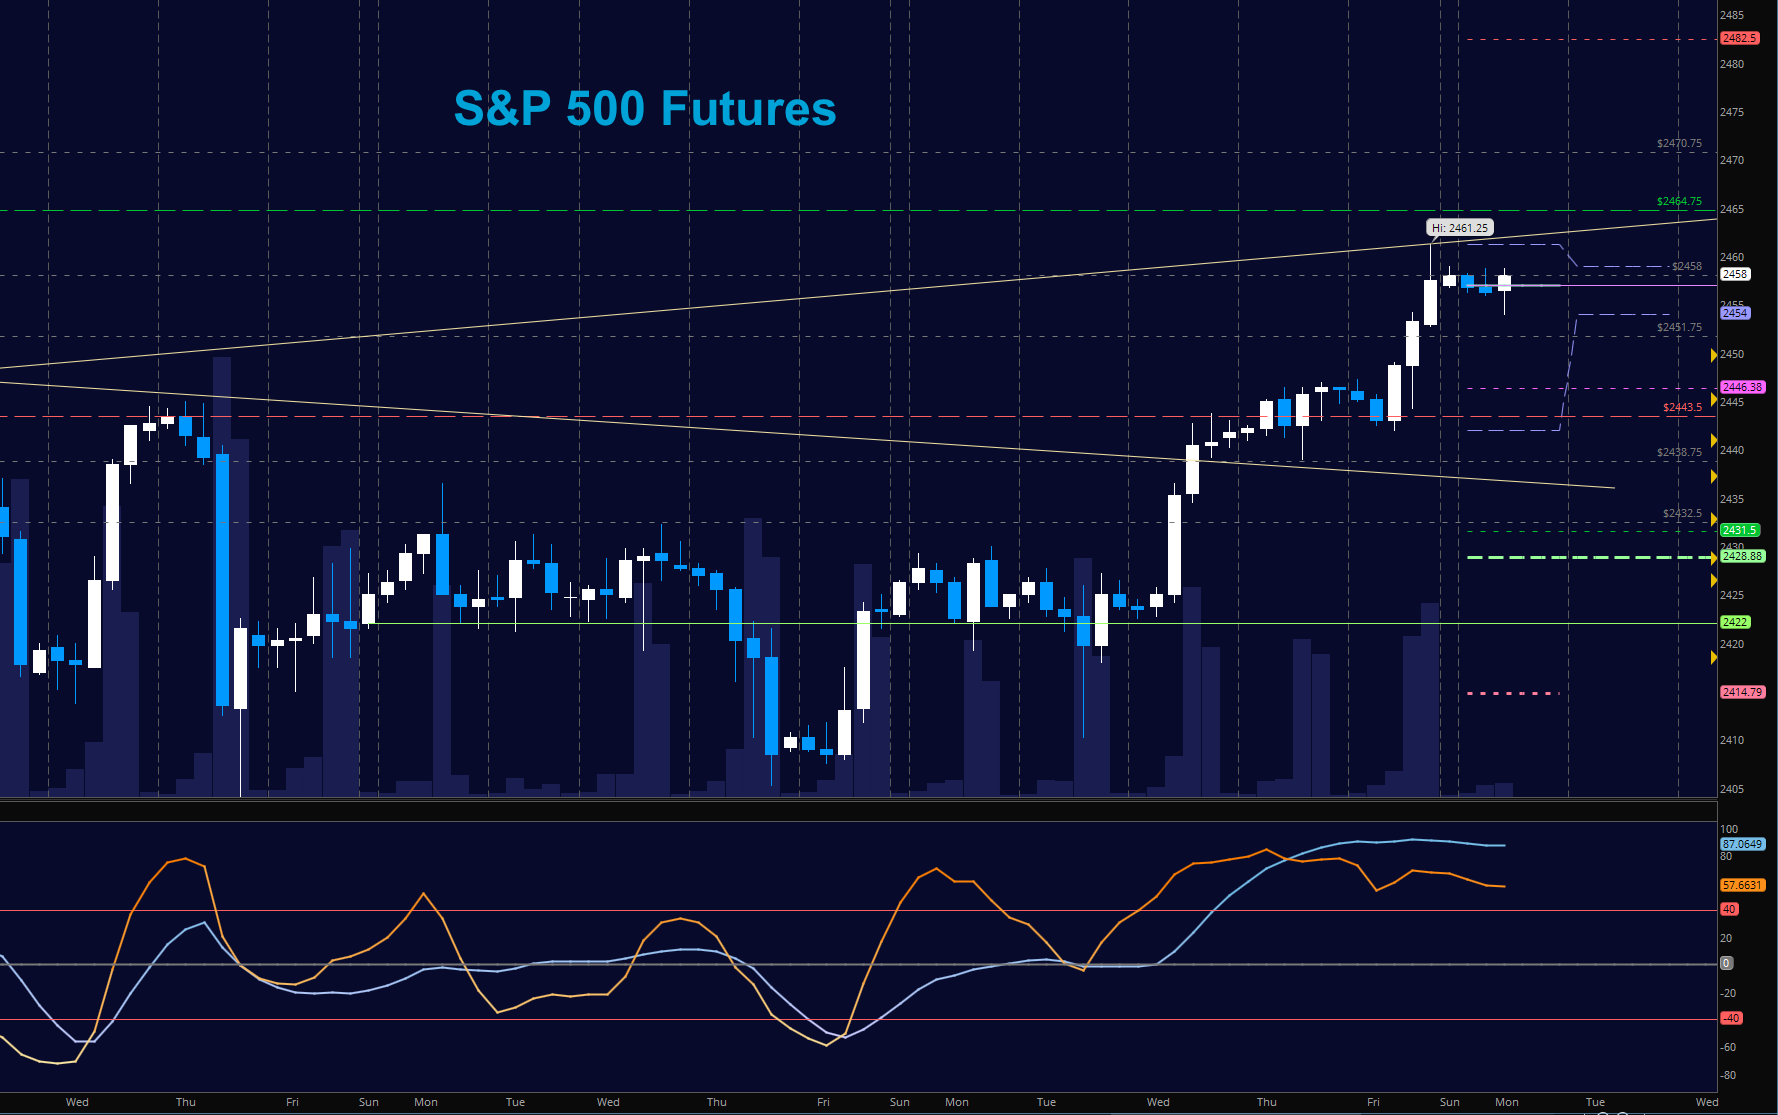
S&P 500 Futures (ES)
Buyers take the winning side on Friday and have held higher ground. Momentum still suggests that pullbacks will find buyers, but breakouts will be tougher to hold. Though this was not the case for Friday, it does seem to be on the horizon for today. The bullets below represent the likely shift of trading momentum at the positive or failed retests at the levels noted.
- Buying pressure intraday will likely strengthen above a positive retest of 2458(careful again here with resistance)
- Selling pressure intraday will likely strengthen with a failed retest of 2451
- Resistance sits near 2458 to 2461.5, with 2464.75 and 2470.5 above that.
- Support holds between 2454 and 2451.75, with 2446.25 and 2441.5 below that.
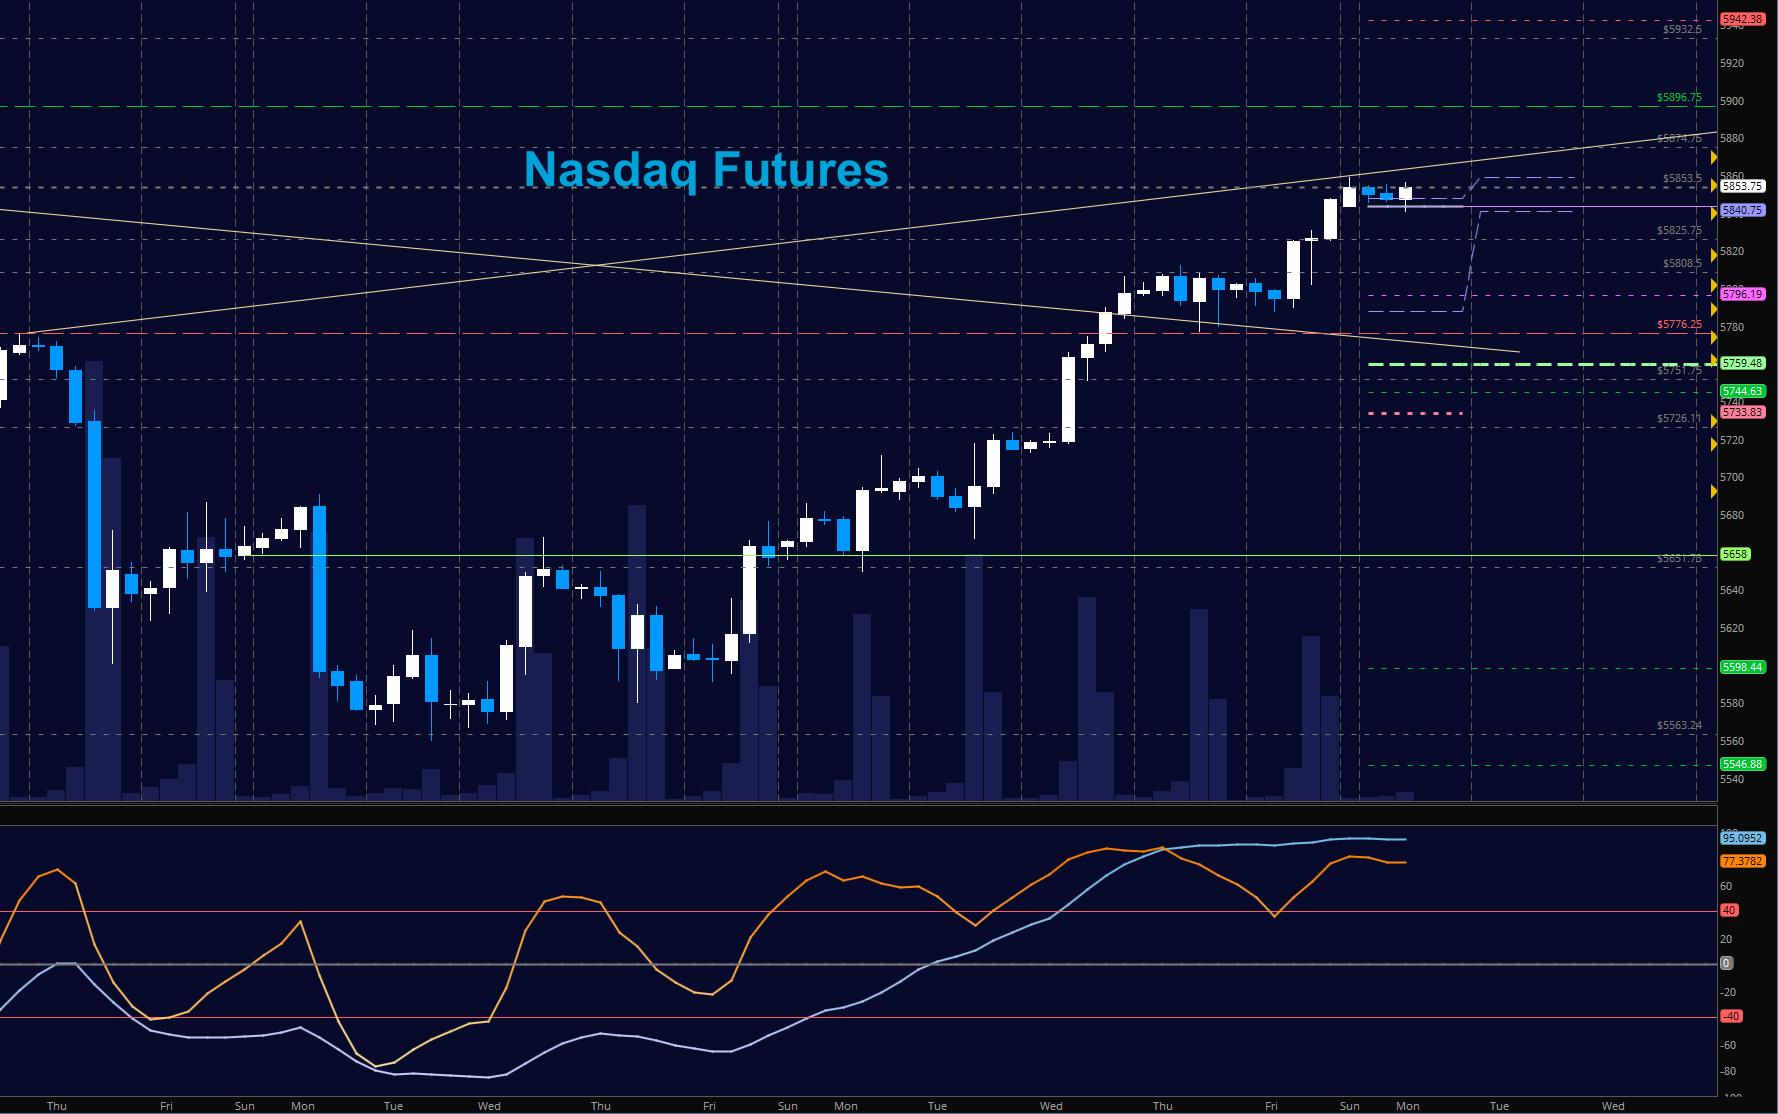
NASDAQ Futures (NQ)
Nasdaq futures here have also stalled after another big move upward. Resistance above the 5857 regions can continue above into 5874 and 5896.75. Buyers hold the power so pullbacks are still buying zones. The bullets below represent the likely shift of intraday trading momentum at the positive or failed tests at the levels noted.
- Buying pressure intraday will likely strengthen with a positive retest of 5854.5
- Selling pressure intraday will likely strengthen with a failed retest of 5825
- Resistance sits near 5858.75 to 5874.75, with 5896.75 and 5932.5 above that.
- Support holds between 5840.75 and 5825.5, with 5796.5 and 5759.5 below that.
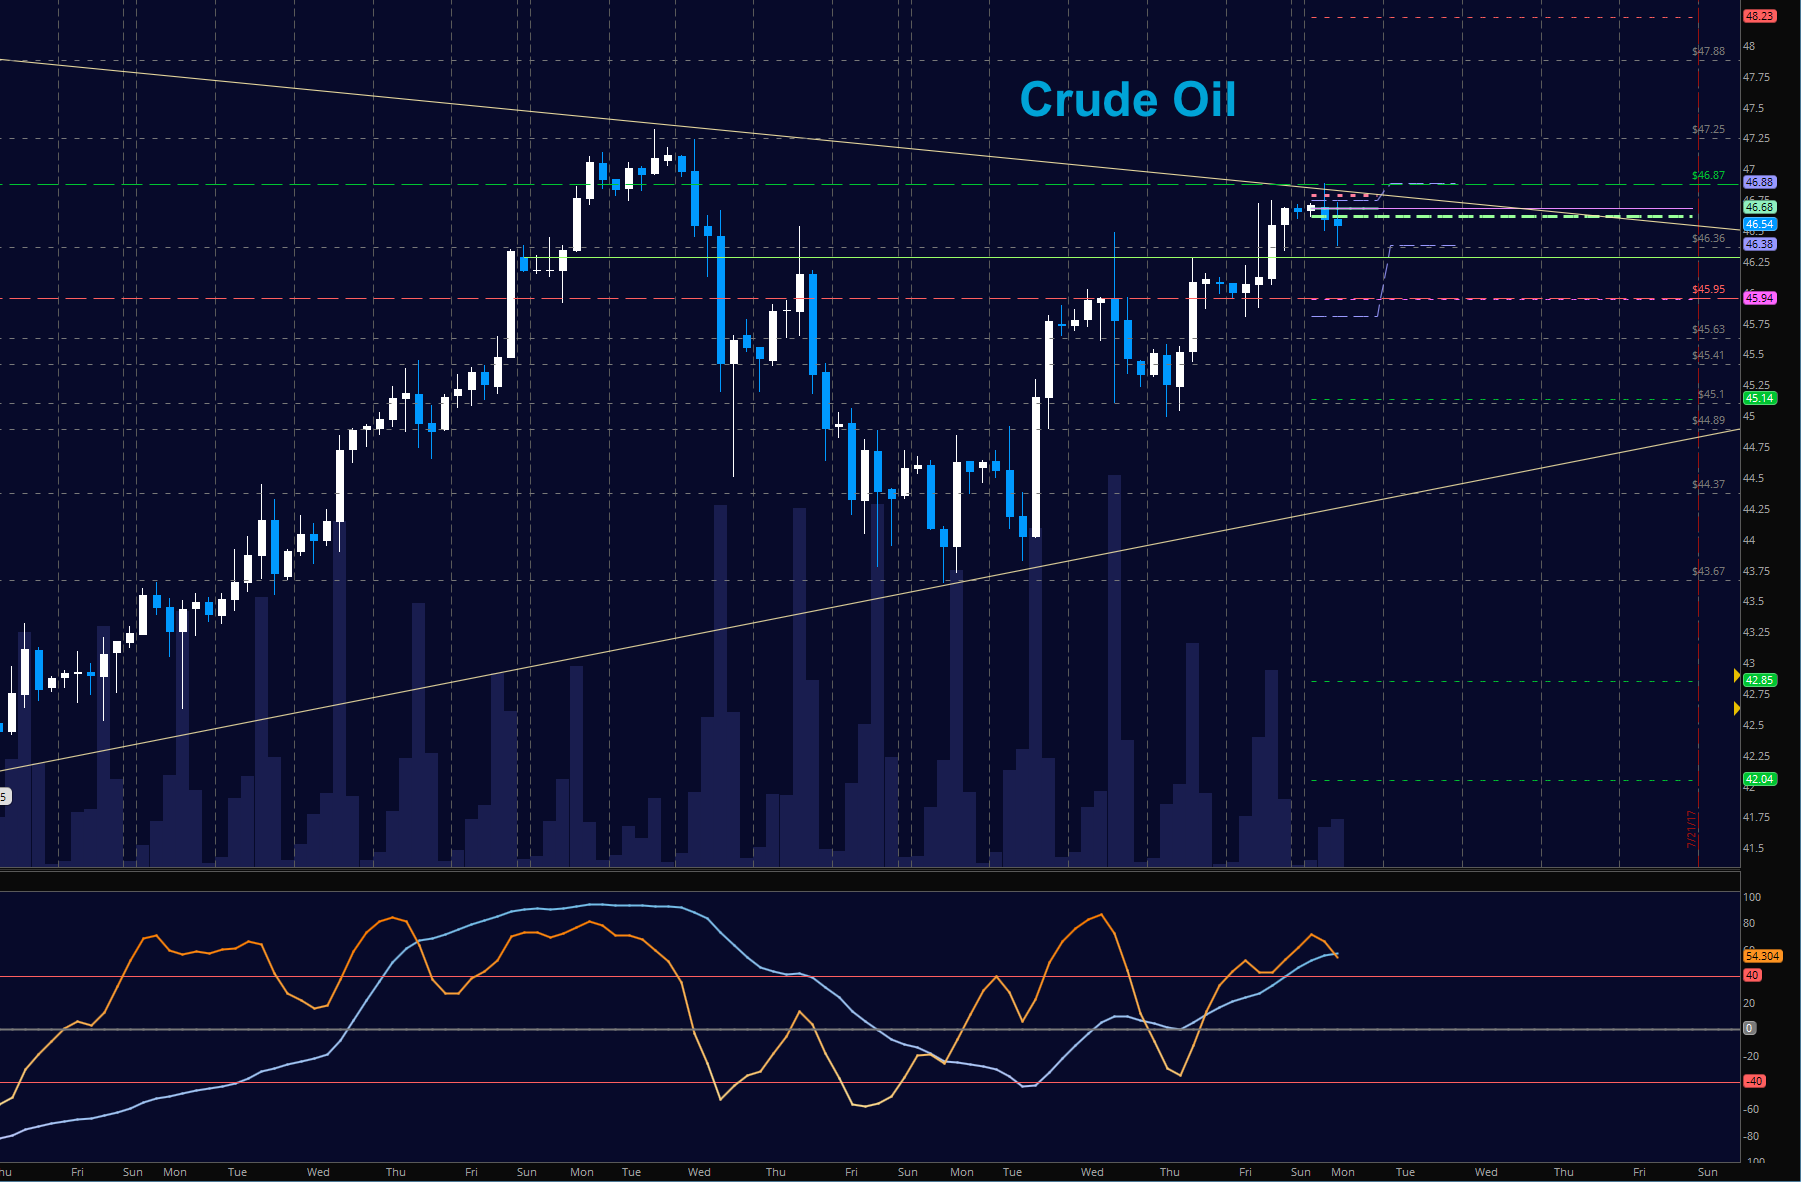
WTI Crude Oil
We moved into the tight resistance regions near 47 – BUT – presenting lower highs after hours of holding new support higher near 46.68. This will be a battleground. Buyers win above positive tests of 46.8 and sellers win below failed tests of 46.28. Momentum is flat to slightly upward, suggesting that buyers will find support even as we look frothy here at the topping areas. The bullets below represent the likely shift of trading momentum at the positive or failed tests at the levels noted.
- Buying pressure intraday will likely strengthen with a positive retest of 46.88(careful -resistance ahead)
- Selling pressure intraday will strengthen with a failed retest of 46.28
- Resistance sits near 46.68 to 46.9, with 47.25 and 47.88 above that.
- Support holds between 46.36 to 46.16, with 45.75 and 45.25 below that.
If you’re interested in watching these trades go live, join us in the live trading room from 9am to 11:30am each trading day. Visit TheTradingBook for more information.
If you’re interested in the live trading room, it is now primarily stock market futures content, though we do track heavily traded stocks and their likely daily trajectories as well – we begin at 9am with a morning report and likely chart movements along with trade setups for the day.
As long as the trader keeps himself aware of support and resistance levels, risk can be very adequately managed to play in either direction as bottom picking remains a behavior pattern that is developing with value buyers and speculative traders.
Twitter: @AnneMarieTrades
The author trades stock market futures every day and may have a position in mentioned securities at the time of publication. Any opinions expressed herein are solely those of the author, and do not in any way represent the views or opinions of any other person or entity.


