Stock Market Trading Considerations For February 23, 2017
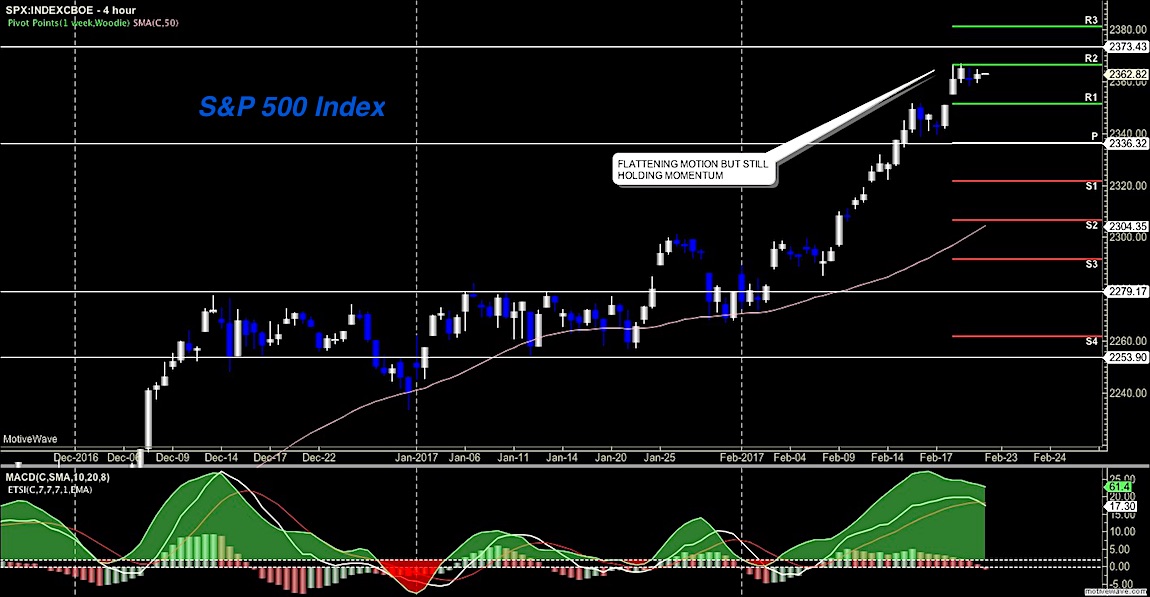
The S&P 500 (INDEXSP:.INX) has flattened out a bit but still holds momentum. This suggests that market pullbacks will still provide solid opportunities to move in the prevailing upside trend. Price levels remain the same as yesterday. Federal Reserve minutes speak showed a hesitancy on raising rates, keeping prices elevated and potentially opening a new cycle of upside motion.
Buying pressure on S&P 500 Futures will likely strengthen above a positive retest of 2363.5, while selling pressure will strengthen with a failed retest of 2354.
Price resistance sits near 2363.5 to 2366.75, with 2369.25 and 2372.5 above that. Price support holds between 2354.75 and 2350.25, with 2346.25 and 2342.5 below that
See today’s economic calendar with a rundown of releases.
TRADING SETUPS
E-mini S&P Futures – February 23
Upside trades – Two options for entry
- Positive retest of continuation level -2360.5
- Positive retest of support level– 2357
- Opening target ranges – 2351, 2354.5, 2357, 2359.75, 2362.25, 2365, 2369.25, 2372.25, 2375.75
Downside trades – Two options for entry
- Failed retest of resistance level – 2359
- Failed retest of support level – 2354.25
- Opening target ranges – 2356.75, 2354.5, 2350.5, 2346.25, 2343.25, 2337.5, 2334, 2329.25, 2323.5, 2319, 2315.25, 2313, 2309.75, 2304.75, 2302.75, 2299.5, 2297, 2294.25, 2291.75, 2288.5, 2284.5, 2279.75, 2276.25, 2274.25, 2272.25, 2269.5, 2264.5, 2260.5, 2256, 2253.5 and 2249.75
Nasdaq Futures
The NQ_F presented a new high this morning and still holds a bullish trend -momentum has continued to hold well and another new high looks like it is over the horizon. Pullbacks continue to be bought and trends across time frames are still bullish in general. Expansions into Fibonacci extensions look like 5367.75 to 5381.5
- Buying pressure will likely strengthen with a positive retest of 5358.5
- Selling pressure will strengthen with a failed retest of 5329
- Resistance sits near 5355.25 to 5357, with 5364.75 and 5367.75 above that
- Support holds between 5329.25 and 5320.5, with 5306.75 and 5297.25 below that
Upside trades – Two options
- Positive retest of continuation level – 5352.5 (not ideal due to needed stop size)
- Positive retest of support level – 5343.25
- Opening target ranges – 5346.75, 5350.5, 5354.5, 5360.25, 5364.5, 5367.75, 5382.75
Downside trades- Two options
- Failed retest of resistance level – 5347 ( watch the 5343 regions for support)
- Failed retest of support level – 5335.5
- Opening target ranges – 5343, 5338.75, 5335.75, 5331.5, 5325.5, 5320.25, 5315.75, 5306.5, 5297.75, 5294.25, 5291.25, 5286.75, 5277.75, 5273.75, 5271.25, 5266.75, 5263.25, 5259, 5252.75, 5246.75, 5240.25, 5235.25, 5229.75, 5227.75, 5221.75, 5217.75, 5212.5, 5207.5
Crude Oil –WTI
After a six week streak of builds in inventory, the API report revealed a draw yesterday and we are holding higher levels into the morning. We are outside a wide channel of price action so I suspect we could easily see another move to the north as hedge funds continue to hold their bullish stand.
- Buying pressure will likely strengthen with a positive retest of 54.67
- Selling pressure will strengthen with a failed retest of 53.8
- Resistance sits near 54.88 to 55.15, with 55.6 and 56.05 above that.
- Support holds between 53.8 and 53.55, with 53.09 and 52.68 below that.
Upside trades – Two options
- Positive retest of continuation level – 54.6
- Positive retest of support level – 54.24
- Opening target ranges – 53.35, 53.68, 53.88, 54.05, 54.19, 54.54, 54.85, 55.04, 55.12, 55.48, 55.68, 55.88, 56.04
Downside trades- Two options
- Failed retest of resistance level – 54.2
- Failed retest of support level – 53.8
- Opening target ranges – 54.05, 53.88, 53.56, 53.31, 53.09, 52.85, 52.64, 52.37, 52.2, 52.06, 51.91, 51.72, 51.52, 51.22, 51.04, 50.82, 50.47, 50.3, and 50.16
If you’re interested in the live trading room, it is now primarily stock market futures content, though we do track heavily traded stocks and their likely daily trajectories as well – we begin at 9am with a morning report and likely chart movements along with trade setups for the day.
As long as the trader keeps himself aware of support and resistance levels, risk can be very adequately managed to play in either direction as bottom picking remains a behavior pattern that is developing with value buyers and speculative traders.
Twitter: @AnneMarieTrades
The author trades stock market futures every day and may have a position in mentioned securities at the time of publication. Any opinions expressed herein are solely those of the author, and do not in any way represent the views or opinions of any other person or entity.


