Stock Market Outlook for December 21, 2016 –
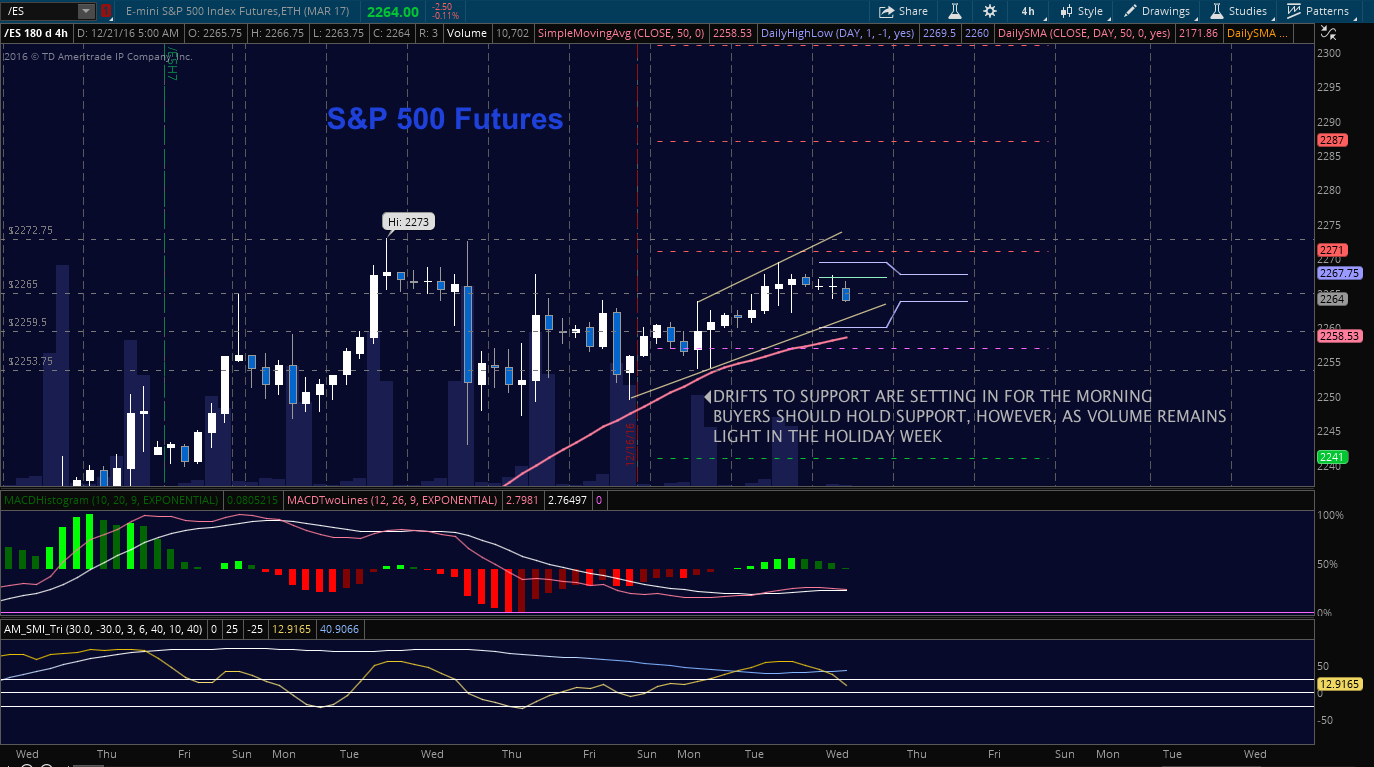
Chart action is stagnant with light volume as we approach midweek. Formations suggest a test of support near 2259 is likely to hold at the first pass, as buyers continue to lift us at value areas. The ranges are tightening a bit. Be patient to enter long as momentum is pointing to lower intraday highs until the tests of support come into play.
The line in the sand for buyers to hold will be 2259, and below that, 2255. Charts will be weighted to the buyers as long as we hold the 2260 test. Resistance remains 2269, but could breach to test 2272.50, then 2282.75, if the charts continue with higher lows.
See today’s economic calendar with a rundown of releases.
TODAY’S RANGE OF MOTION
E-mini S&P 500 Futures Trading Chart For December 21
***Upside trades – Two options for entry–
Positive retest of continuation level -2264.5 (careful here – a retest is required)
Positive retest of support level– 2259
Opening targets ranges -2263.75, 2267.5, 2269.25, 2271.25, 2272.75, 2275.50, 2278.25 and 2282.50
***Downside trades – Two options for entry–
Failed retest of resistance level -2262 (needs retest confirmation)
Failed retest of support level– 2259.25 (also needs confirmation due to price forms)
Opening target ranges –2261.50, 2257, 2254.75, 2251.5, 2249.50, 2246.50, 2242.75, 2238.75, 2234.75, 2231.50, 2227.75, 2224.25, and 2224.25
Nasdaq Futures
The NQ_F did well to hold near to top of its range overnight, but has begun a drift into support levels this morning. Our ranges are very tight again, and so we’ll be looking for a breach of price action once more. Momentum is holding steady, and traders are now holding 4947 as support with 4936.75 below that. Resistance now holds near 4957 to 4963..
***Upside trades – Two options
Positive retest of continuation level -4952.50 (needs confirmation)
Positive retest of support level– 4937.50 (also needs confirmation)
Opening target ranges –4942.25, 4947, 4952.25, 4957.75, 4965.50, 4972.25, 4979.75, and 4988.75
***Downside trades- Two options
Failed retest of resistance level -4957.50 (careful here – negative divergence needs to be present)
Failed retest of support level– 4936
Opening target ranges –4952.25, 4947.5, 4944.75, 4937.25, 4931.50, 4925.75, 4920.75, 4914.25, 4907.50, 4902.75, 4898.75, 4883.75, 4876.25, 4872.25, 4863.75, 4859.75, 4854.75, and 4847.50
WTI Crude Oil
The oil chart is back into resistance levels seen Sunday night. Momentum still holds generally positive. Yesterday’s resistance is being tested as we speak, near 53.59, and though it sits at resistance now, it seems that it could easily breach and retest as new support though the day. That 53.56-53.60 region will be the region to watch for shifts higher or lower. Resistance is near 54.1, and then 54.55, if we breach and hold 53.6. Jagged trading should be the order of the day as trending formations have not strengthened. Support levels are near 52.84, and 52.22 below that, if we lose 53.5.
***Upside trades – Two options
Positive retest of continuation level -53.39
Positive retest of support level– 52.24
Opening target ranges –52.34, 52.54, 52.87, 53.23, 53.41, 53.6, 53.86, 54.04, 54.21, 54.5, 54.97, and 55.4
***Downside trades- Two options
Failed retest of resistance level -53.46
Failed retest of support level– 53.13
Opening target ranges –53.24, 53.06, 52.84, 52.55, 52.32, 52.09, 51.85, 51.57, 51.32, 51.08, 50.27, 50.13, 49.87, 49.6, 49.27, 49.05, and 48.92
If you’re interested in watching these trades go live, join us in the live trading room from 9am to 11:30am each trading day.
Visit TheTradingBook for more information.
If you’re interested in the live trading room, it is now primarily stock market futures content, though we do track heavily traded stocks and their likely daily trajectories as well – we begin at 9am with a morning report and likely chart movements along with trade setups for the day.
As long as the trader keeps himself aware of support and resistance levels, risk can be very adequately managed to play in either direction as bottom picking remains a behavior pattern that is developing with value buyers and speculative traders.
Twitter: @AnneMarieTrades
The author trades stock market futures every day and may have a position in mentioned securities at the time of publication. Any opinions expressed herein are solely those of the author, and do not in any way represent the views or opinions of any other person or entity.

: Showing Some Signs of Emerging Strength")
