Stock Market Outlook for December 12, 2016 –
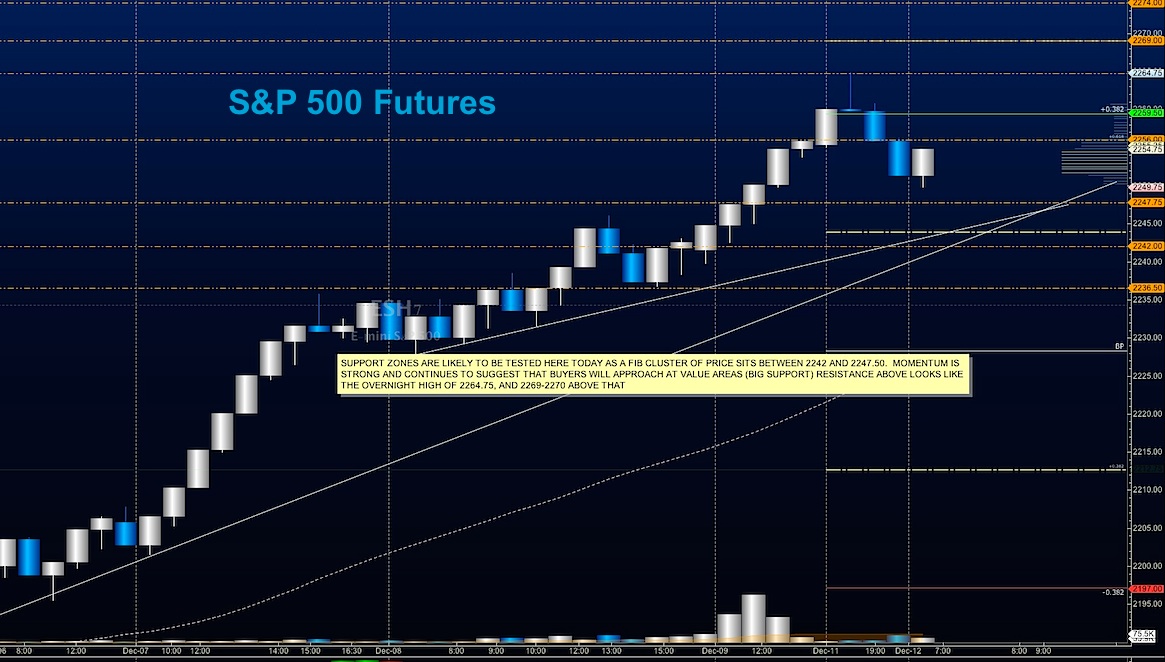
As the rate hike probability holds above 94%, traders are assuming that markets can handle the event of a shift of interest rates upward by 25 basis points. S&P 500 futures have drifted off its high of 2264.75 and is holding just above a fib cluster between 2242 and 2247.50. This price region will be the line in the sand for buyers to hold today.
Price support levels to watch below that level are 2240.75-2236.75. Historically, bullish action occurs on the S&P 500 (INDEXSP:.INX) prior to FOMC releases, and we show (at least technically, that this is quite likely within the current formations). Price resistance is well above us and in uncharted territory.
Fibonacci price extensions show 2246.5 to 2270.50- so a shallow dip to support into 2246.5 seems probable at some juncture. Conservative traders are either waiting for the market to exhaust after having taken profits long, and are watching for the retrace to resume upside; or they are trailing the market up. New shorts at the recent highs seem fairly dangerous. Momentum remains bullish, so buyers will continue to get involved at support zones.
See today’s economic calendar with a rundown of releases.
TODAY’S RANGE OF MOTION
S&P 500 Futures Trading Chart – December 12
Upside trades – Two options for entry
Positive retest of continuation level – 2256.75 –a retest of this level is particularly important as sellers sit here waiting at 2256
Positive retest of support level – 2247
Opening targets ranges – 2251.50, 2253.75, 2256, 2260.50, 2263.75, 2267.75, 2270.25, and 2275.50
Downside trades – Two options for entry
Failed retest of resistance level -2255.50
Failed retest of support level– 2246.50
Opening target ranges – 2253.75, 2249.50, 2246.50, 2241.25, 2237.75, 2234.75, 2231.50, 2227.75, 2224.25, and 2224.25
Nasdaq Futures
The NQ_F stretched quite close to its high of the year overnight, but failed to breach as well as finding sellers in the mix to bring it back to the breakout levels seen on Friday around 4862. This will be the level buyers will need to hold or risk a drift down to 4851.75 and 4842 after that. Momentum is positive but drifting. Resistance now holds near 4896 to 4888, but a breach there could send us back to 4916.50 and 4929.
Upside trades – Two options
Positive retest of continuation level – 4882.50
Positive retest of support level – 4862.50
Opening target ranges – 4865.50, 4869.50, 4870.75, 4876, 4880, 4884.75, 4890.25, 4894.50, 4900.25, 4905.25, 4916, and potentially 4929.25
Downside trades – Two options
Failed retest of resistance level – 4880.50
Failed retest of support level – 4861.50
Opening target ranges – 4876.25, 4870.25, 4863.75, 4854.75, 4847.50, 4844.50, 4840.25, 4836.50, and 4836.50
Crude Oil –WTI
OPEC news overnight has oil at its highest level in years. Higher lows are still present on larger time frames, and resistance has expanded into a low market auction region between 54.40 and 57. Support levels intraday sit near 53.5 and again at 52.56. We have a gap between 51.48 and 52.48
Upside trades – Two options
Positive retest of continuation level – 54.28
Positive retest of support level – 52.56
Opening target ranges – 52.83, 53.03, 53.52, 53.93, 54.21, 54.5, 54.97, and 55.4
Downside trades – Two options
Failed retest of resistance level – 53.50
Failed retest of support level – 52.8 – (watch for support at 52.56)
Opening target ranges – 52.86, 52.56, 52.34, 52.14, 51.89, 51.64, 51.47, 50.27, 50.13, 49.87, and 49.6
If you’re interested in watching these trades go live, join us in the live trading room from 9am to 11:30am each trading day.
Visit TheTradingBook for more information.
If you’re interested in the live trading room, it is now primarily stock market futures content, though we do track heavily traded stocks and their likely daily trajectories as well – we begin at 9am with a morning report and likely chart movements along with trade setups for the day.
As long as the trader keeps himself aware of support and resistance levels, risk can be very adequately managed to play in either direction as bottom picking remains a behavior pattern that is developing with value buyers and speculative traders.
Twitter: @AnneMarieTrades
The author trades stock market futures every day and may have a position in mentioned securities at the time of publication. Any opinions expressed herein are solely those of the author, and do not in any way represent the views or opinions of any other person or entity.


: Showing Some Signs of Emerging Strength")
