S&P 500 Futures Outlook for August 5, 2016 – Broad Overview
Employment numbers are out, but it is questionable whether the response will create anything more than a wick in the daily candlestick event. Buyers and sellers have battled for two days in the current range between 2160-2165, but today, the buyers have held us to higher lows as they edge into resistance near 2166-2168. S&P 500 (INDEXSP:.INX) momentum is fairly neutral, so breakouts or breakdowns should retrace somewhat. 2153 remains important on S&P 500 futures, and below that we see 2145-2141.5 and then 2138.5 to 2135.75 as support levels. Price resistance holds steady between 2172 and 2177 today, and if breached, should easily retest.
See today’s economic calendar with a rundown of releases.
RANGE OF TODAY’S MOTION
S&P 500 Futures Outlook – Trading Chart (ES_F)
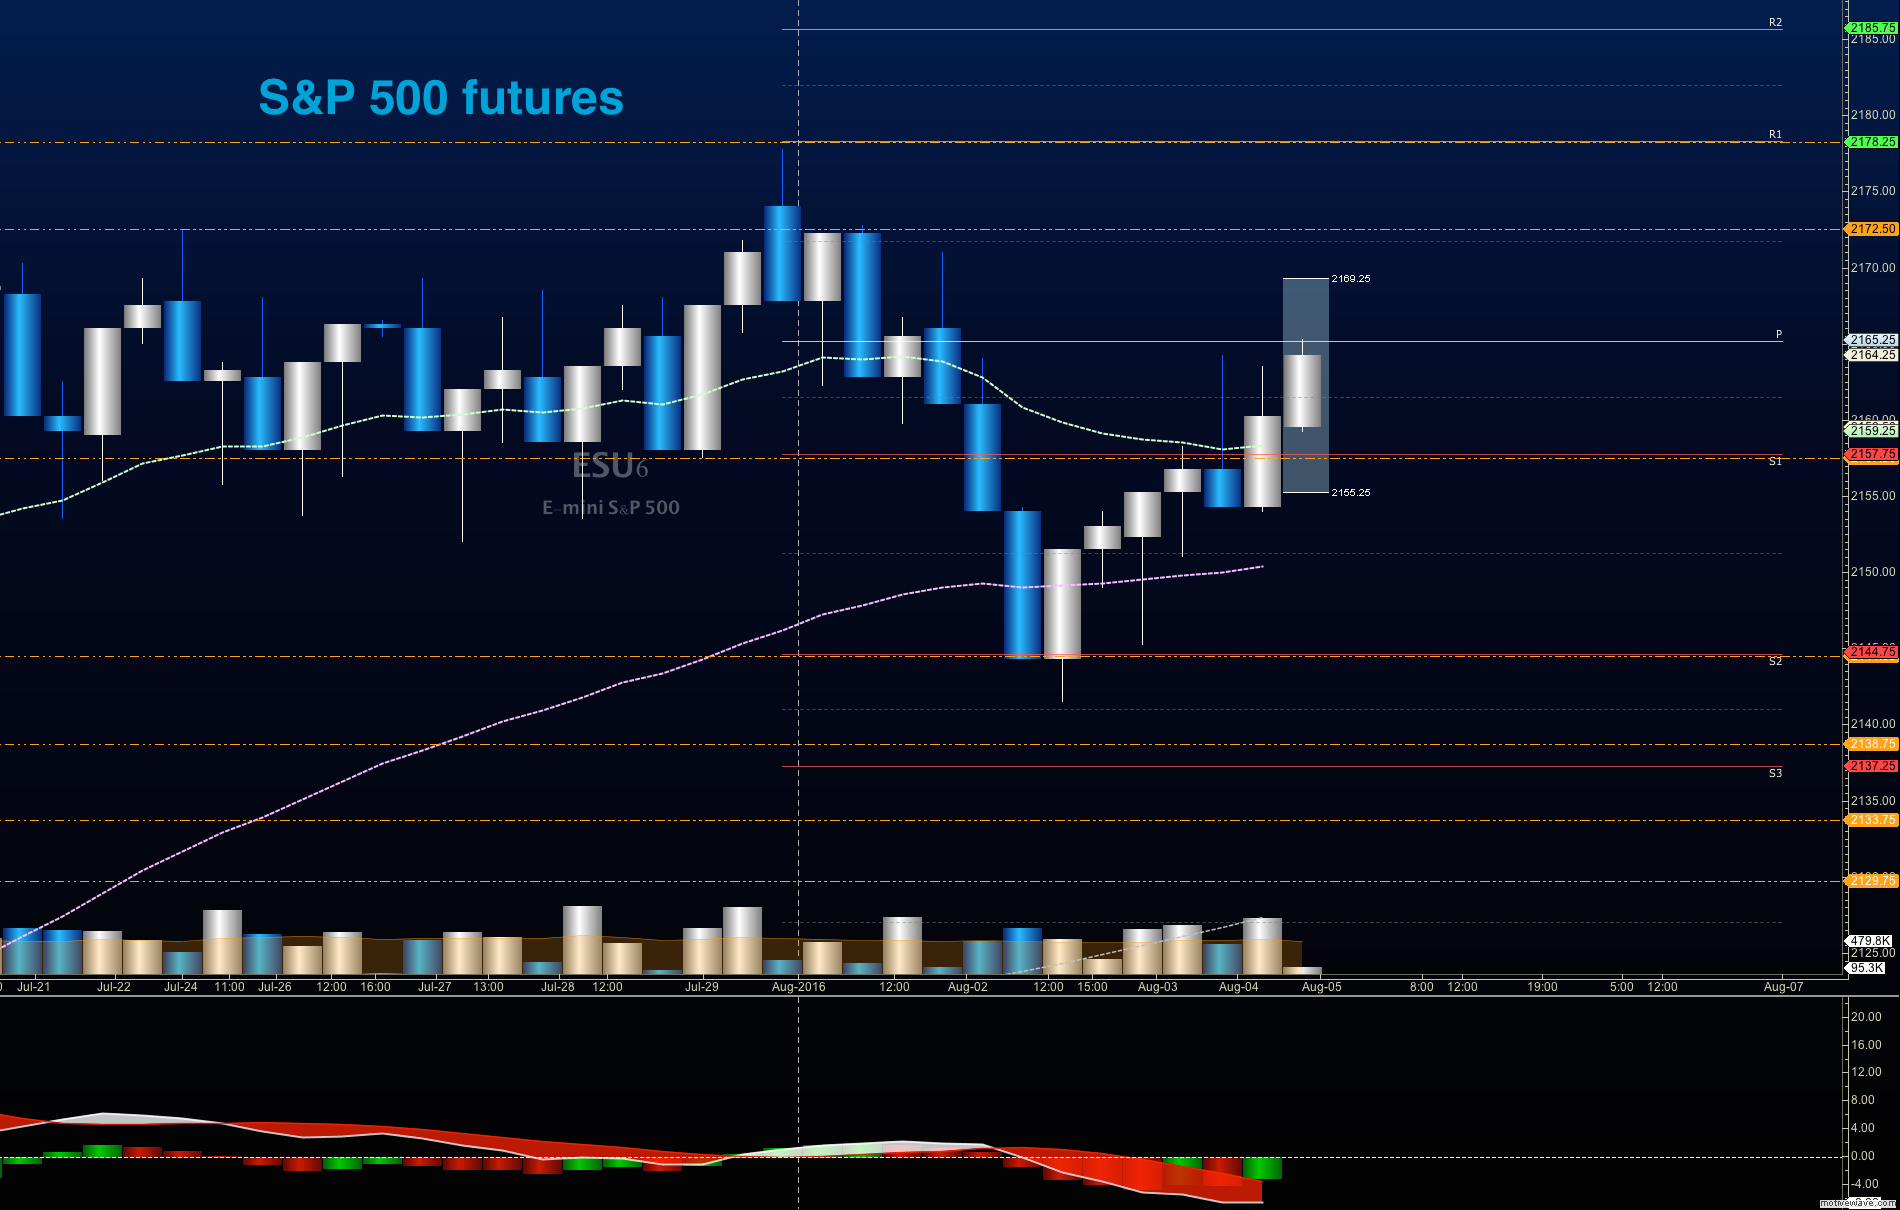
Upside trades on S&P 500 futures – Favorable setups sit on the positive retest of 2164.5, or a positive retest of the bounce off 2159 with positive momentum. Remember that the feel of the chart is congestion, so breakouts will be difficult to maintain. I use the 30min to 1hr chart for the breach and retest mechanic. Targets from 2159 are 2161.5, 2164.25, 2166.25, 2169.25, 2171, 2174.75, 2177.25, 2179.25, 2180.25, and if we expand, we may stretch above into 2184.5 and 2189.75.
Downside trades on S&P 500 futures – Favorable setups sit below the failed retest of 2157.75 or at the first failed retest of 2168.75 with negative divergence. Keep your eyes on the lookout for higher lows developing intraday. Retracement into lower levels from 2168.75 gives us the targets 2164.5, 2161.5, 2159.5, 2156.75, 2153.5, 2151.5, 2149.5, 2145.75, 2143.25, 2141.5, 2139.5, 2136.75, and 2128.5, if sellers take over.
If you’re interested in watching these trades go live, join us in the live trading room from 9am to 11:30am each trading day.
Nasdaq Futures (NQ_F)
The NQ_F rejected a double top on the 4hr chart but is holding momentum, suggesting a pullback will have higher lows, and so far that has been the case, holding 4751 since 5am ET. New support rests near 4740.5, with a lower break into 4732.5; 4721 looms if sellers gain traction. Resistance levels are still between 4744.75-4760, with a breach that could stretch into 4772. Breakouts continue to fail retests, and buyers continue to save the day.
Upside trades on Nasdaq futures – Favorable setups sit on the positive retest of 4753.25, or a positive retest of 4742.5 with positive momentum. I use the 30min to 1hr chart for the breach and retest mechanic. Watch for the lower high to develop with this range break below 4744.5, as sellers may attempt to exercise more power intraday. Targets from 4742.5 are 4744.5, 4747.75, 4749.75, 4751.75, 4756.25, 4759.25, 4767.75, and 4772, if buyers continue the rally north.
Downside trades on Nasdaq futures – Favorable setups sit below the failed retest of 4740.75, or at the failed retest of 4751.5 with negative divergence. Retracement into lower levels from 4751.5 gives us the targets 4746.75, 4744.5, 4742.5, 4739.75, 4735.75, 4730.5, 4726.5, 4724.25, 4721.5, 4717.5, 4714.75, 4710.75, 4708.5, 4705.75, 4703, 4698.75, 4693.75, 4691.25, 4687.75, 4682.25, 4678.5, 4672.25, 4664.75, and 4660.5 to 4658.5, if sellers resume control.
Crude Oil
WTI crude oil lifted yesterday as expected, but not quite into the resistance level at 42.26, as I presumed, but I seem to be a day ahead of these as my target from Wednesday of 41.54 came on Thursday, so perhaps today we’ll see the pop into 42.26 or so. Traders are trying to hold the bounce near this old target of 41.54, but the move seems quite aggressive so a fade to 41.2 before a bounce might be in the cards. Pullbacks are likely to be bought in the current cycle even as significant resistance holds ahead.
Trading ranges for crude oil should hover between 40.50 and 42.65, with the number near 41.45 being a very important number for the chart to hold if we are buyers.
Upside trades on crude oil can be staged on the positive retest of 41.98, or at a bounce off 40.5 with positive momentum. I often use the 30min to 1hr chart for the breach and retest mechanic. Targets from 40.5 are 40.52, 40.74, 40.85, 41.09, 41.12, 41.21, 41.4, 41.67, 41.86, 42.07, 42.24, 42.45, 42.78, 42.9, and perhaps, 43.1, if buyers really take control.
Downside trades on crude oil can be staged on the failed retest of 41.4, or at the failed retest of 42.65 with negative divergence. Targets from 42.65 are 42.26, 42.11, 41.98, 41.75, 41.63, 41.54, 41.4, 41.16, 40.94, 40.77, 40.57, 40.34, 40.19, 39.87, 39.56, 39.38, 39.26, 39.02, 38.74, 38.42 and 38.22.
If you’re interested in watching these trades go live, join us in the live trading room from 9am to 11:30am each trading day. It is now primarily stock market futures trading content, though we do track heavily traded stocks and their likely daily trajectories as well – we begin at 9am with a morning report and likely chart movements along with trade setups for the day. Visit TheTradingBook.com for more information.
As long as the trader keeps himself aware of support and resistance levels, risk can be very adequately managed to play in either direction as bottom picking remains a behavior pattern that is developing with value buyers and speculative traders.
Twitter: @AnneMarieTrades
The author trades stock market futures every day and may have a position in mentioned securities at the time of publication. Any opinions expressed herein are solely those of the author, and do not in any way represent the views or opinions of any other person or entity.


