S&P 500 Futures Overview for August 12, 2016 – Stocks Head Higher But Market Momentum Soft.
Traders pushed the market higher and out of congestion near 2177 on the S&P 500 futures trading chart. This lead to new highs on stock market futures and the cash S&P 500 Index (INDEXSP:.INX). That said, market momentum continues to be unimpressive. This is why we continue to watch support and resistance price levels closely.
New price support sits near 2180 and heavy congestion lies just below, between 2174-2177. Price resistance is shifted up slightly into 2185.25, but could stretch into 2189.75. Buyers are still in charge, and market pullbacks are still likely to be bought. But we are on watch, as pullbacks could be to deeper support levels, as momentum is not aggressive.
See today’s economic calendar with a rundown of releases.
RANGE OF TODAY’S MOTION
S&P 500 Futures Trading Chart – (ES_F)
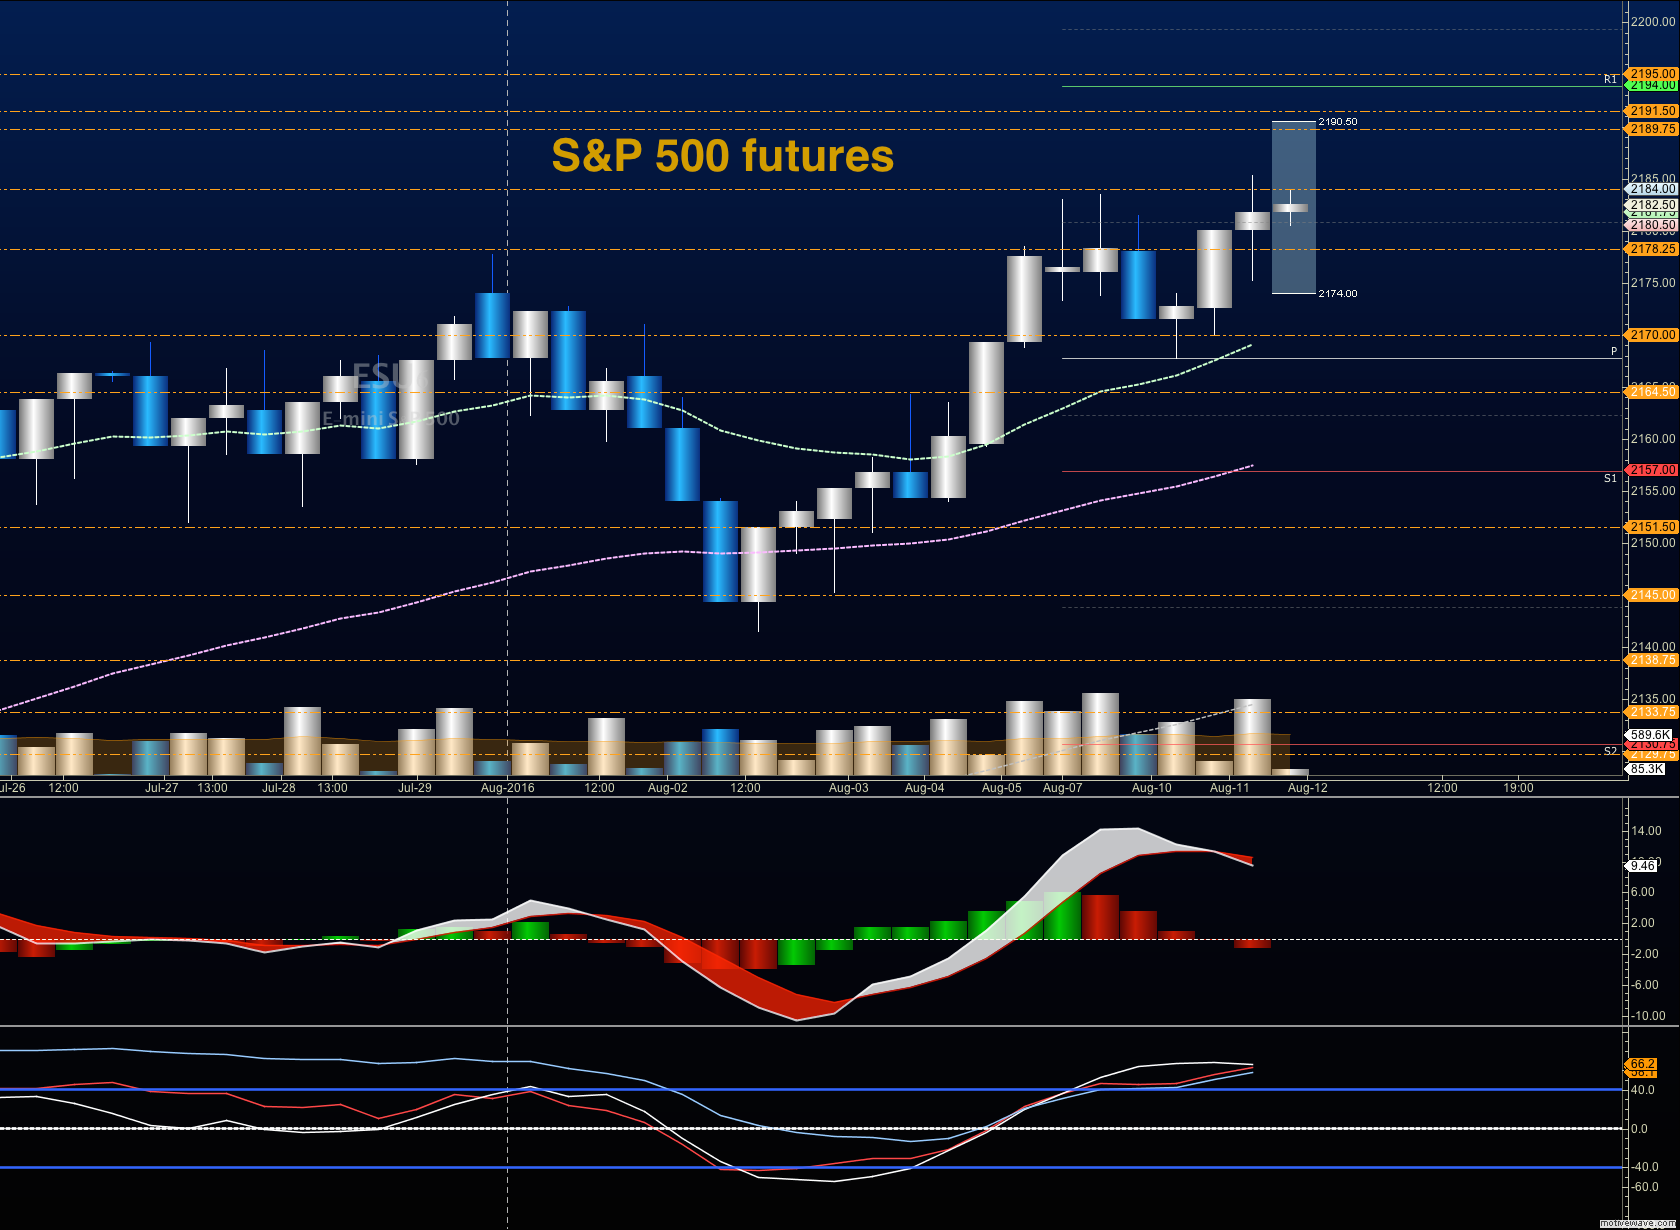
Upside trades on S&P 500 futures – Favorable setups sit on the positive retest of 2180.5, or a positive retest of the bounce off 2178.5 with positive momentum. I use the 30min to 1hr chart for the breach and retest mechanic. Targets from 2178.5 are 2180.5, 2183.5, 2185.5, 2187.5 and if we expand, we may stretch above into 2189.75 and 2191.5.
Downside trades on S&P 500 futures – Favorable setups sit below the failed retest of 2178 or at the failed retest of 2183 with negative divergence. Keep your eyes on the lookout for higher lows developing intraday. Retracement into lower levels from 2183 gives us the targets 2180.75, 2178.5, 2175.75, 2172.5, 2169.5, 2164.5, 2161.5, 2157.5, and 2153.5, if sellers take over.
If you’re interested in watching these trades go live, join us in the live trading room from 9am to 11:30am each trading day.
Nasdaq Futures broke to new highs at yesterday’s open, before returning to breakout levels near 4796.5. Large expansions upside should still fade. Support sits at 4793.75.
If 4793.75 fails, lower support sits at 4786.75. Price resistance levels remains between 4808.75-4811.5, with a breach that could stretch into 4818 – 4825.75 in the coming days. Retests of support action for long entries have worked nicely, and should continue to do so. Pay attention to lower highs or lower lows developing, as this could signal a rollover event. Momentum remains damp.
Upside trades on Nasdaq futures – Favorable setups sit on the positive retest of 4797.75, or a positive retest of 4805.25 with positive momentum. I use the 30min to 1hr chart for the breach and retest mechanic. Targets from 4797.75 are 4802.5, 4805.5, 4808.5, 4811.25, 4816.25, and 4818.25 to 4825.75, if buyers continue the rally north.
Downside trades on Nasdaq futures – Favorable setups sit below the failed retest of 4805.5, or at the failed retest of 4797.5 with negative divergence. Retracement into lower levels from 4805.5 gives us the targets 4802.25, 4797.5, 4793.75, 4790.25, 4786.5, 4781.5, 4776.75, 4772.25, 4766.5, 4762.25, 4754.5, 4746.75, 4743.5, 4739.75, 4735.75, 4730.5, and 4726.5 to 4721.5, if sellers resume control.
Crude Oil staged a swift bounce into resistance near 44.25. Support holds at 42.9, but we are holding 43.3 at this time. Price resistance sits near 44.43, and 44.76 above that.
Trading ranges for crude oil should hover between 42.48 and 44.74, but this upper level seems extremely unlikely in the current environment.
Upside trades on crude oil can be staged on the positive retest of 43.35, or at a bounce off 42.9 with positive momentum. I often use the 30min to 1hr chart for the breach and retest mechanic. Targets from 42.9 are 43.27, 43.54, 43.85, 44.02, 44.14, 44.43, and perhaps, 44.74, if buyers really take control.
Downside trades on crude oil can be staged on the failed retest of 43.29, or at the failed retest of 44.02 with negative divergence. Targets from 44.02 are 43.86, 43.54, 43.32, 43.04, 42.90, 42.68, 42.44, 42.29, 42.04, 41.86, 41.72, 41.63, 41.46, 41.11, 40.96, 40.79, 40.54, 41.22 and 40.82, if sellers really resume control.
If you’re interested in watching these trades go live, join us in the live trading room from 9am to 11:30am each trading day.
Visit TheTradingBook.com for more information.
If you’re interested in the live trading room, it is now primarily futures content, though we do track heavily traded stocks and their likely daily trajectories as well – we begin at 9am with a morning report and likely chart movements along with trade setups for the day.
As long as the trader keeps himself aware of support and resistance levels, risk can be very adequately managed to play in either direction as bottom picking remains a behavior pattern that is developing with value buyers and speculative traders.


")
 Ready To Break Out?")
