S&P 500 Futures Stock Market Outlook for August 11, 2016 – The Trading Range Tightens.
Trading ranges from open to close continue to tighten on the weekly charts, as the S&P 500 Index (INDEXSP:.INX) fails to breakout above new resistance. This doesn’t mean that it won’t happen, but also worth noting that moving averages are flattening. We sit near familiar support on the S&P 500 futures at 2177. This comes after bouncing from lower levels near 2168.5., a major price congestion zone (that remains supportive down to 2166).
Price resistance is shifted up slightly into 2184.5, but could stretch into 2187.5. Buyers are still in charge, but that overhead supply is still giving them trouble. The jobs number may give us a badly needed spark to move out of this tight range in S&P 500 futures trading.
See today’s economic calendar with a rundown of releases.
RANGE OF TODAY’S MOTION
S&P 500 Futures Trading Outlook – Trading Chart (ES_F)
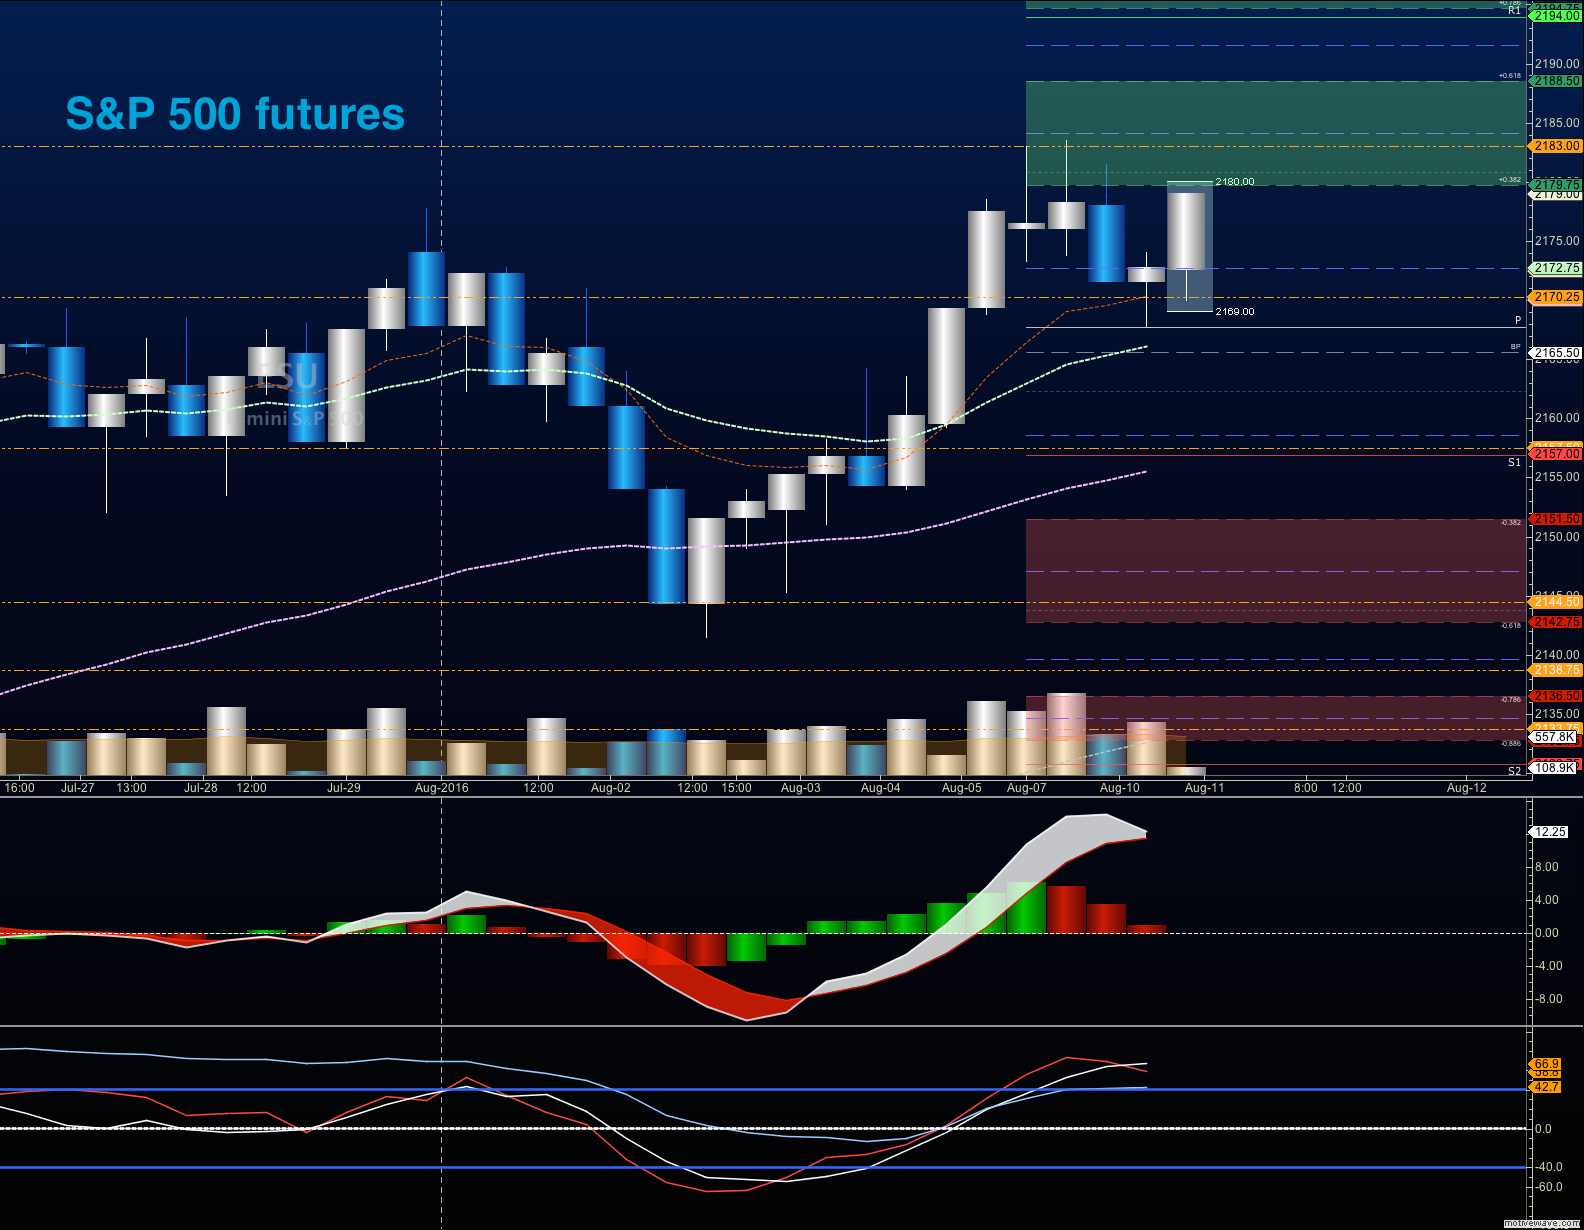
Upside trades in S&P 500 futures trading – Favorable setups sit on the positive retest of 2183, or a positive retest of the bounce off 2174.5 with positive momentum. I use the 30min to 1hr chart for the breach and retest mechanic. Targets from 2174.5 are 2177, 2180.25, 2183, 2184.75, 2187.5 and if we expand, we may stretch above into 2189.75 and 2190.5.
Downside trades in S&P 500 futures trading – Favorable setups sit below the failed retest of 2174 or at the failed retest of 2182.5 with negative divergence. Keep your eyes on the lookout for higher lows developing intraday. Retracement into lower levels from 2182.5 gives us the targets 2178, 2176.75, 2174.5, 2172.5, 2169.5, 2167.5, 2164.5, 2161.5, 2159.5, 2157.5, and 2153.5, if sellers take over.
If you’re interested in watching these trades go live, join us in the live trading room from 9am to 11:30am each trading day.
Nasdaq Futures (NQ_F)
The NQ_F sits range bound over the last several days, and is sitting at the top of the range. Large expansions upside should fade. Overhead supply continues to be a problem for the charts. Support sits at 4780.5. Below that, we see 4775.75 as lower support. Resistance levels remains between 4797-4808.75, with a breach that could stretch into 4818 – 4825.75 in the coming days, if buyers can get up over these sellers poised at resistance. Retests of support action for long entries have worked nicely, and should continue to do so. Pay attention to lower highs or lower lows developing, as this could signal a rollover event.
Upside trades in Nasdaq futures trading – Favorable setups sit on the positive retest of 4797, or a positive retest of 4781.5 with positive momentum. I use the 30min to 1hr chart for the breach and retest mechanic. Targets from 4781.5 are 4784.5, 4787.75, 4792.25, 4794.75, 4796.25, 4798.25, 4800.5, 4804.75, 4808.75, 4812, 4816.25, and 4818.25 to 4825.75, if buyers continue the rally north.
Downside trades in Nasdaq futures trading – Favorable setups sit below the failed retest of 4780, or at the failed retest of 4796.5 with negative divergence. Retracement into lower levels from 4796.5 gives us the targets 4793.75, 4790.25, 4787.5, 4784.25, 4781.5, 4776.75, 4772.25, 4766.5, 4762.25, 4754.5, 4746.75, 4743.5, 4739.75, 4735.75, 4730.5, and 4726.5 to 4721.5, if sellers resume control.
Crude Oil
EIA reported a build as analysts expected a draw, bringing charts down into 41.10 or so, before bouncing. Support holds at 41.1, but we are holding 41.7 at this time. This deep pullback is driving buyers back, but several levels of resistance now stand in the way of advancement. Hopeful buyers look to OPEC for changes in production, but that seems very unlikely as Iran and Saudi Arabia battle for market share through increased production.
Trading ranges for crude oil should hover between 41.1 and 42.2
Upside trades on crude oil can be staged on the positive retest of 41.84, or at a bounce off 41.44 with positive momentum. I often use the 30min to 1hr chart for the breach and retest mechanic. Targets from 41.44 are 41.72, 41.88, 42.2, 42.46, 42.74, 42.97, 43.14, 43.32, 43.54, 43.77, 43.93, and perhaps, 44.14, if buyers really take control.
Downside trades on crude oil can be staged on the failed retest of 42.2, or at the failed retest of 41.4 with negative divergence. Targets from 42.2 are 42.04, 41.86, 41.72, 41.63, 41.46, 41.11, 40.96, 40.74, 40.59, 40.34, 40.19, 39.87, 39.56, 39.38, 39.26, 39.02, 38.74 and 38.42, but these downward levels seem quite unlikely at this time.
If you’re interested in the live trading room, it is now primarily stock market futures content, though we do track heavily traded stocks and their likely daily trajectories as well – we begin at 9am with a morning report and likely chart movements along with trade setups for the day.
As long as the trader keeps himself aware of support and resistance levels, risk can be very adequately managed to play in either direction as bottom picking remains a behavior pattern that is developing with value buyers and speculative traders.
Twitter: @AnneMarieTrades
The author trades stock market futures every day and may have a position in mentioned securities at the time of publication. Any opinions expressed herein are solely those of the author, and do not in any way represent the views or opinions of any other person or entity.


