Stock Market Futures Trading Overview For April 5, 2017
The S&P 500 (INDEXSP:.INX) is holding higher lows but charts are struggling to recapture key weekly support. This could be a period of rest, or it could be a sign of failing market strength to the upside.
Check out today’s economic calendar with a full rundown of releases. And note that the charts below are from our premium service at The Trading Book and are shared exclusively with See It Market readers.
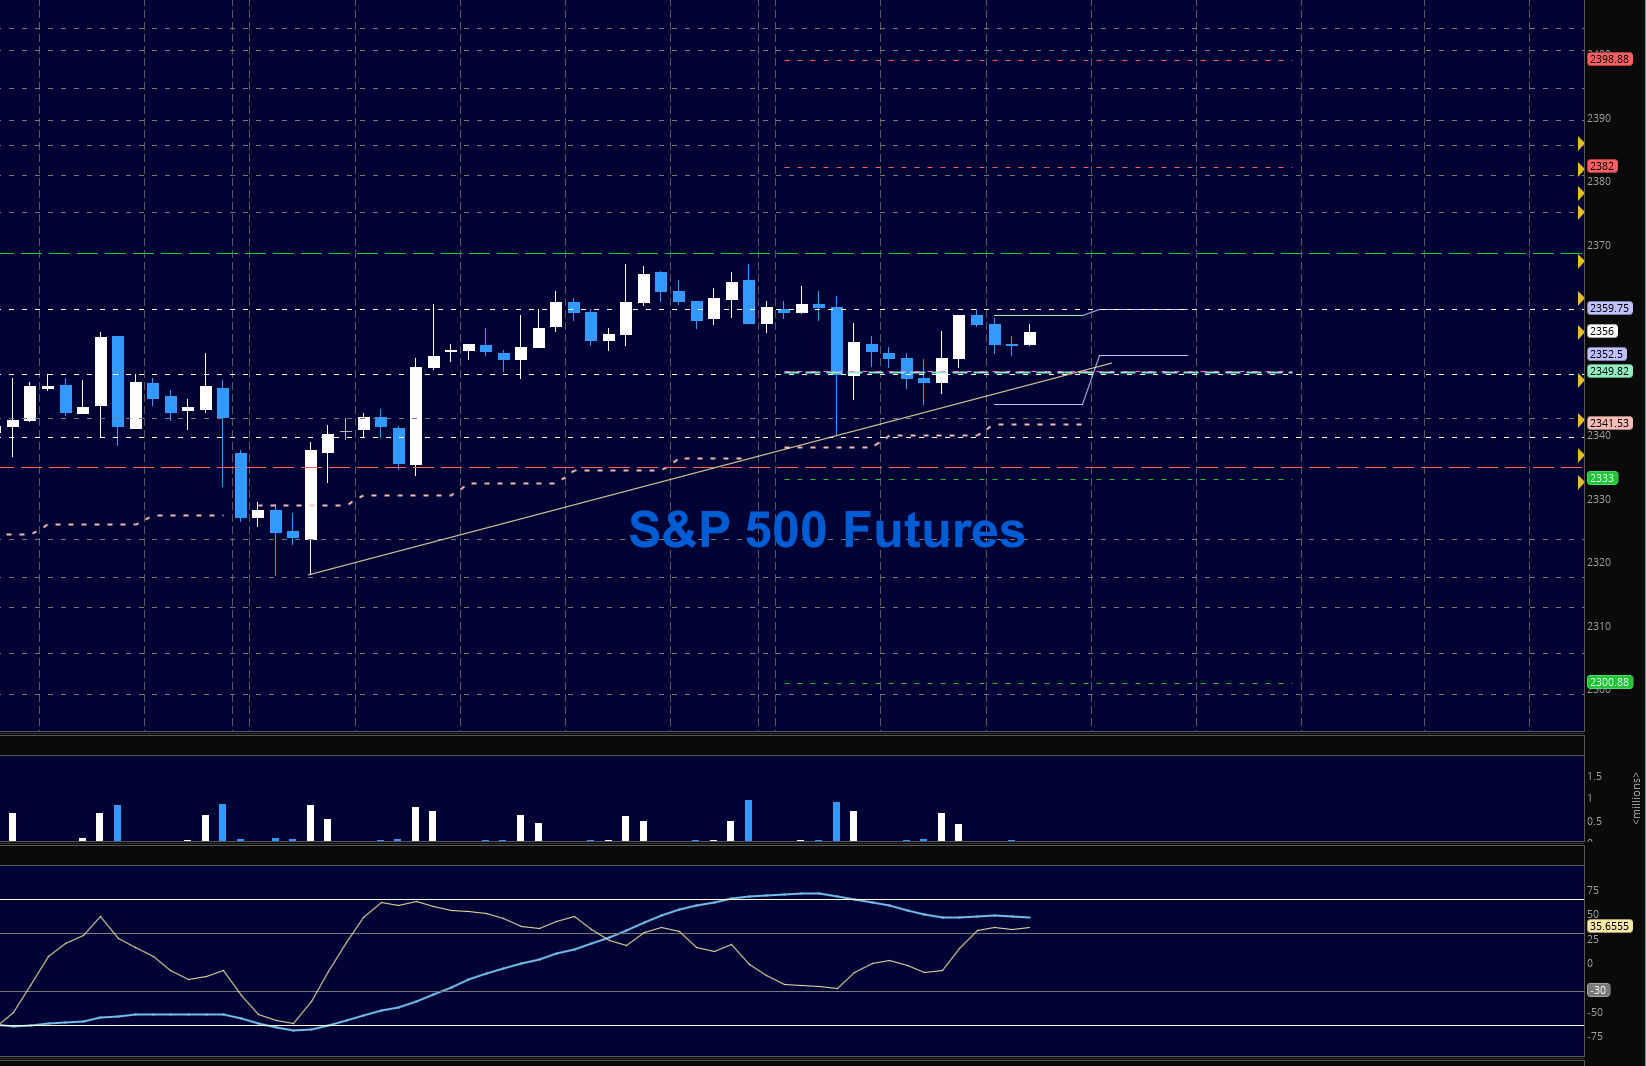
S&P 500 Futures (ES)
The ‘wait and see’ pattern here is very frustrating to traders who are always in a rush to trade. As yesterday, holding 2347 will be key as we continue to build some kind of wedge. We have an FOMC statement ahead today as well. A breach and hold of 2360 will send us back to the top of the congestion range but little evidence exists to assume upside expansion is possible. Setups today are almost identical to yesterday’s due to trading congestion.
- Buying pressure will likely strengthen above a positive retest of 2359.75 (but more resistance is ahead nearby)
- Selling pressure will likely strengthen with a failed retest of 2347
- Resistance sits near 2363.5 to 2366.5, with 2369.5 and 2374.25 above that
- Support holds between 2347.5 and 2342.5, with 2339 and 2330.5 below that
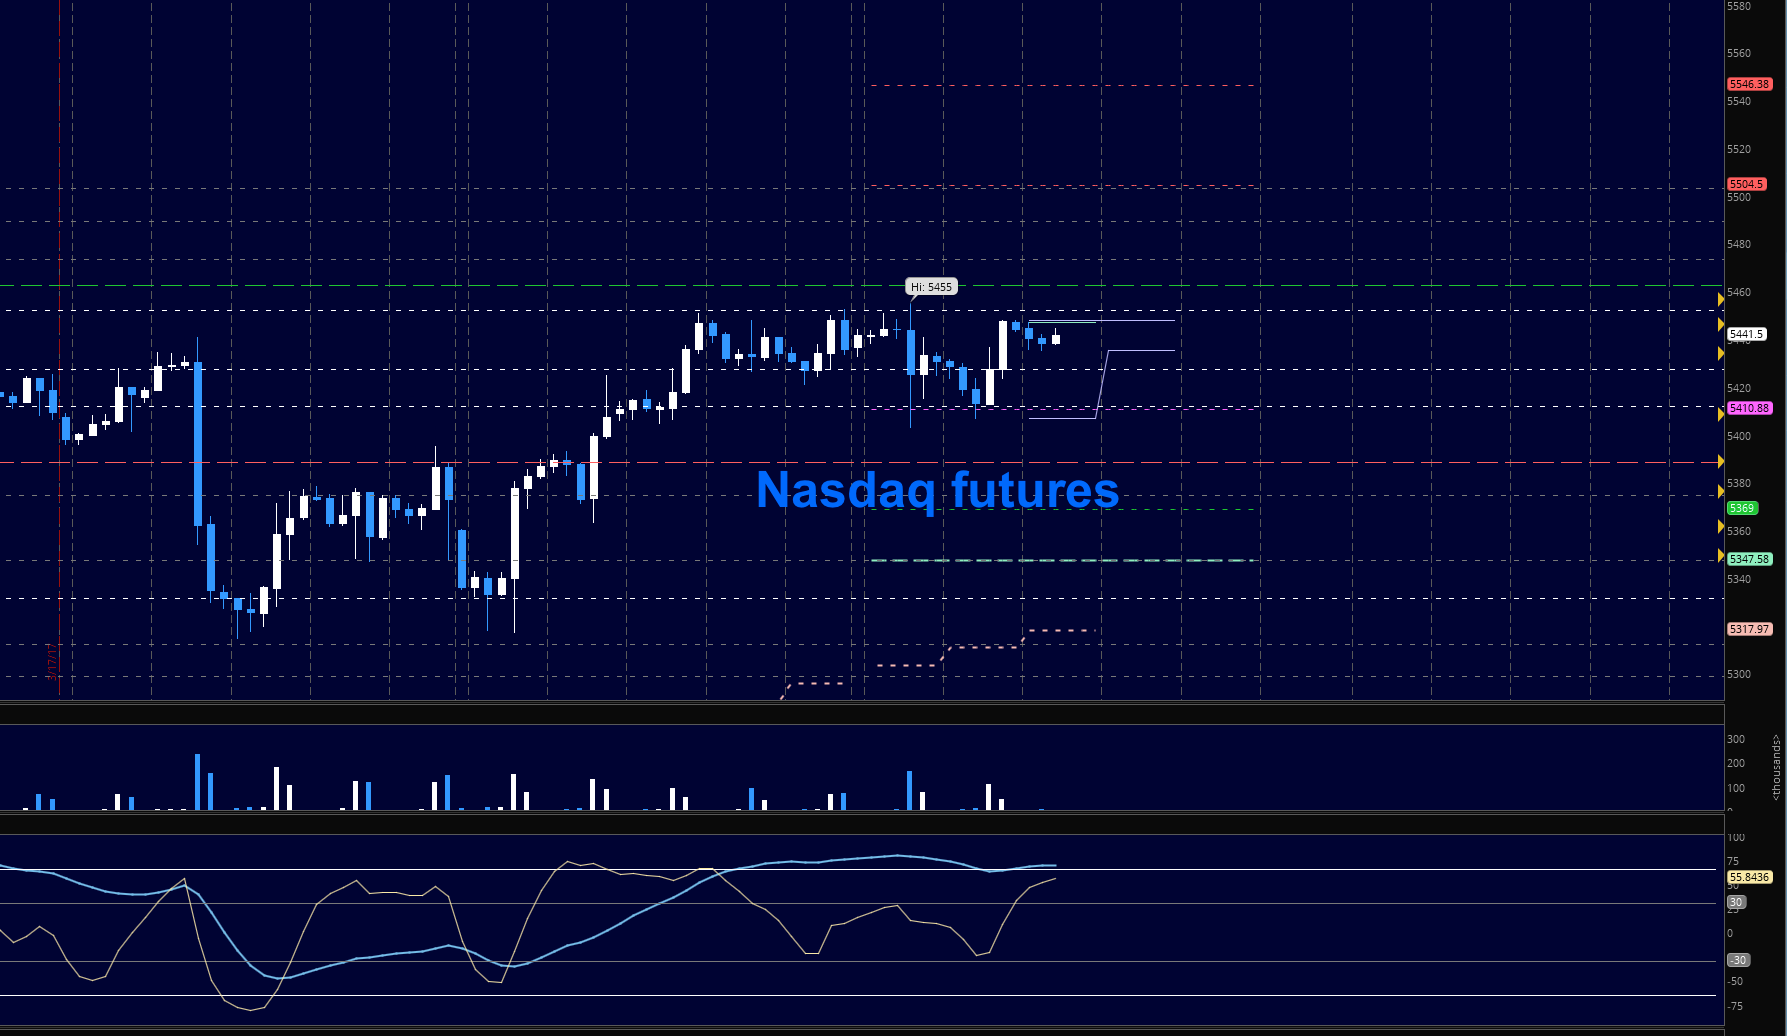
NASDAQ Futures (NQ)
Momentum held steady yesterday as the NQ_F also held the lows of the prior day. Squeezing patterns tell us we are sure to have a break in the near term. It appears we are likely to break up versus breakdown but as I mentioned in past posts, these breaks are not likely to hold. New support levels to watch are in the 5410 region. Fades will be bought in this environment. The chart is not in a breakdown formation. As yesterday, use caution going long at the upper edge of the ranges.
- Buying pressure will likely strengthen with a positive retest of 5456 (use caution as sellers sit up here-wait for a retest)
- Selling pressure will likely strengthen with a failed retest of 5404.75
- Resistance sits near 5452.5 to 5456, with 5462.75 and 5473.5 above that
- Support holds between 5402.75 and 5388.5, with 5374.5 and 5347.5 below that
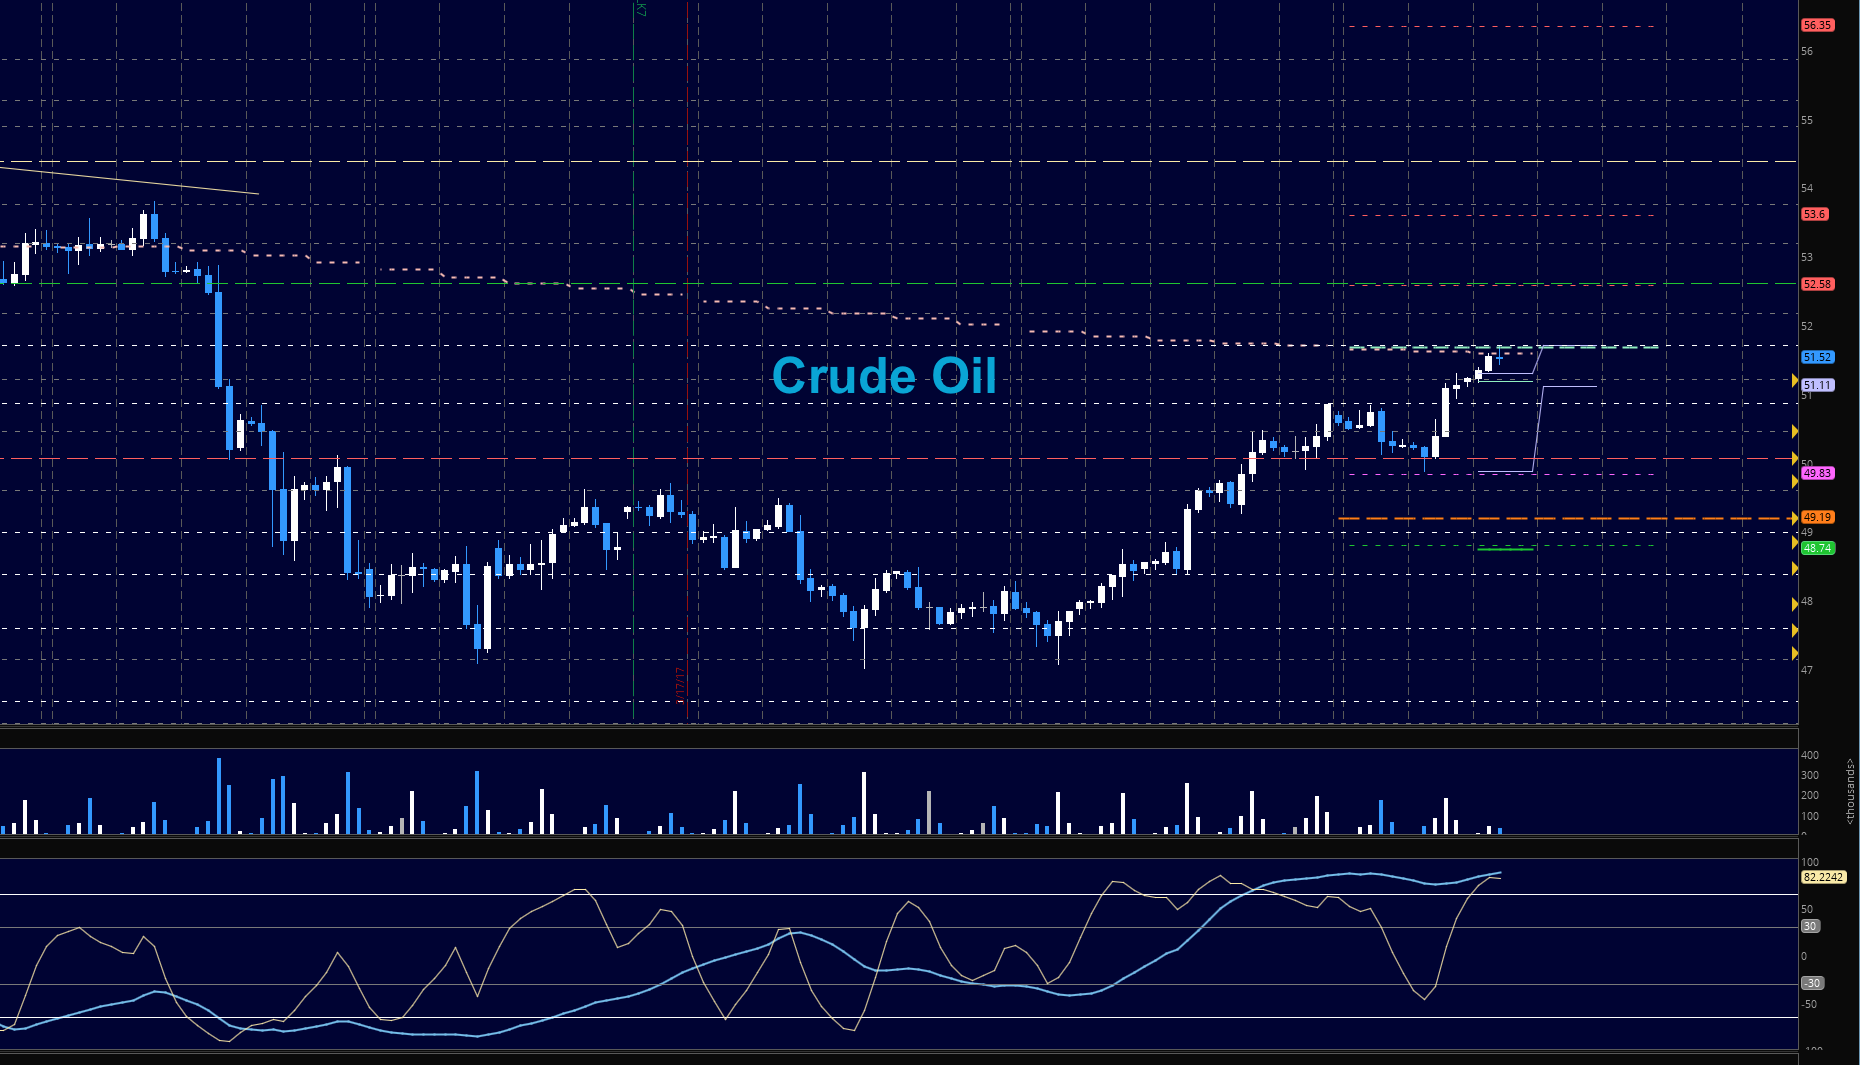
Crude Oil – WTI
Our magnet price of 51.7 was hit early this morning and the ensuing mild fade was right on time. Formations give us higher lows and higher highs in the current cycle. The test of 52.5 is next if we can keep the level at 51.2. Fades will still find buyers as the traders shift into more bullish positions. Today, we have the EIA report ahead at 10:30 am ET – it will be interesting to note the levels of gasoline and distillates, and we should see a drawdown in inventories.
- Buying pressure will likely strengthen with a positive retest of 51.8
- Selling pressure will strengthen with a failed retest of 51.16
- Resistance sits near 51.77 to 52.5, with 52.74 and 53.3 above that.
- Support holds between 51.2 and 50.8, with 50.47 and 50.06 below that.
If you’re interested in watching these trades go live, join us in the live trading room from 9am to 11:30am each trading day. Visit TheTradingBook for more information.
Our live trading room is now primarily stock market futures content, though we do track heavily traded stocks and their likely daily trajectories as well – we begin at 9am with a morning report and likely chart movements along with trade setups for the day.
As long as the trader keeps himself aware of support and resistance levels, risk can be very adequately managed to play in either direction as bottom picking remains a behavior pattern that is developing with value buyers and speculative traders.
Twitter: @AnneMarieTrades
The author trades stock market futures every day and may have a position in mentioned securities at the time of publication. Any opinions expressed herein are solely those of the author, and do not in any way represent the views or opinions of any other person or entity.


