S&P 500 Futures Trading Analysis Chart Image – September 30
MARKET COMMENTARY
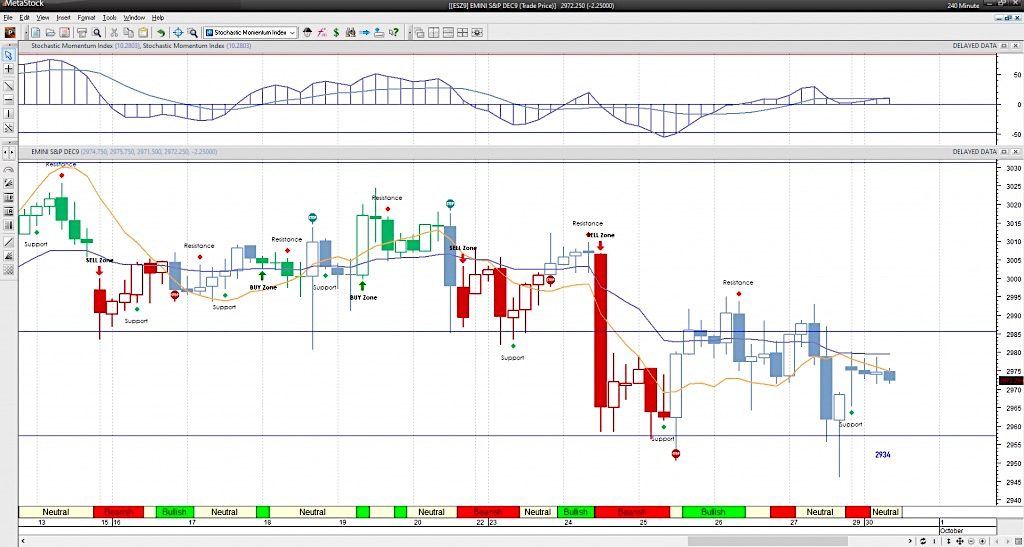
End of the month, end of the quarter yields a bit of volatility that might surprise. Be cautious today. Another deep dip in a market that looks increasingly weaker Friday gives us lower edges of support to watch.
Overnight bounces are in play, but the prior days of sharp bounces up are certainly failing to come about, The weak line of support buyers hold the regions near 2954-2960 – a very key support range tested in three of the last four completed daily candles.
There is some broad based selling once again with buyers still sit by looking for opportunities to engage with limited risk. Dislocated markets remain and these swings on lighter volume and heavier volume fail to confirm direction- which means we are still rangebound but with a bit more bearish risk. Market volatility remains a concern.
WEEKLY PRICE ACTION
Buyers and sellers battle between weekly levels of 2946 and 3012 with neutral momentum in play – edges of contention range remain as in weeks past, between 2984 and 2991. Above that mark and we’ll head to the higher resistance levels near 3006 to 3015 to breach. Neutral action, flattening momentum, and range bound prices are now present. However, if we look at bigger pictures, all the watched indices are still in breakout formations.
This makes for a messy patch of trading.
The line in the sand today is 2991.75 – above this zone, buyers will be more brave. Sellers hold the upper hand below 2959.
COMMODITY & CURRENCY WATCH
Gold prices have responded to negative divergence and are in a solid fade. Low volume regions near 1472-1484 could be the very likely magnet. The region near 1514 is now resistance. Deep pullbacks remain active buy zones – short positioning will require careful attention. The US dollar is holding its upside and now above 99 and near prior resistance of 99.4. My suspicion is that traders are looking for 100. WTI has fallen back into the 55 support area as fears of global slowing continue. Failure to close the week above 55 will be quite bearish.
TRADING VIEW & ACTION PLAN
Buyers are struggling near 2971. Deep pullbacks are still the best places to engage if risk exposure is your primary concern and you are considering long action. Trade the edges of these formations and realize that we could bounce higher than anticipated and fade deeper than anticipated on the monthly close and quarterly close before returning to the range. Follow the trend in the shorter time frames and watch the price action.
The theme of motion is NEGATIVE AS LONG AS WE HOLD BELOW 2978ish today -and POSITIVE AS LONG AS WE HOLD ABOVE 2997ish today. Do what’s working and watch for weakness of trend. Please log in for the definitive levels of engagement today.
Twitter: @AnneMarieTrades
The author trades stock market futures every day and may have a position in mentioned securities at the time of publication. Any opinions expressed herein are solely those of the author, and do not in any way represent the views or opinions of any other person or entity.

 Flirting With Critical Support… Again")
