S&P 500 Futures hourly Trading Chart – August 23
MARKET COMMENTARY
Traders have kept the S&P 500 Index INDEXSP: .INX above 2930 region for a second day as overnight trading saw no sell offs UNTIL THE CHINA NEWS OF NEW TARIFFS HIT THE WIRES.
Trading here without the catalyst means that we could reverse on the highs or lows, so we still wait for comments on the economy from Federal Reserve Chairman Powell coming today.
Continue to watch your edges. Momentum is weaker with light volume but prices AT SUPPORT appear to be firming upside for now. That said, big fades can come in these volatile markets before bounces, so pay attention to the big lines in the sand.
THE PRICE ACTION
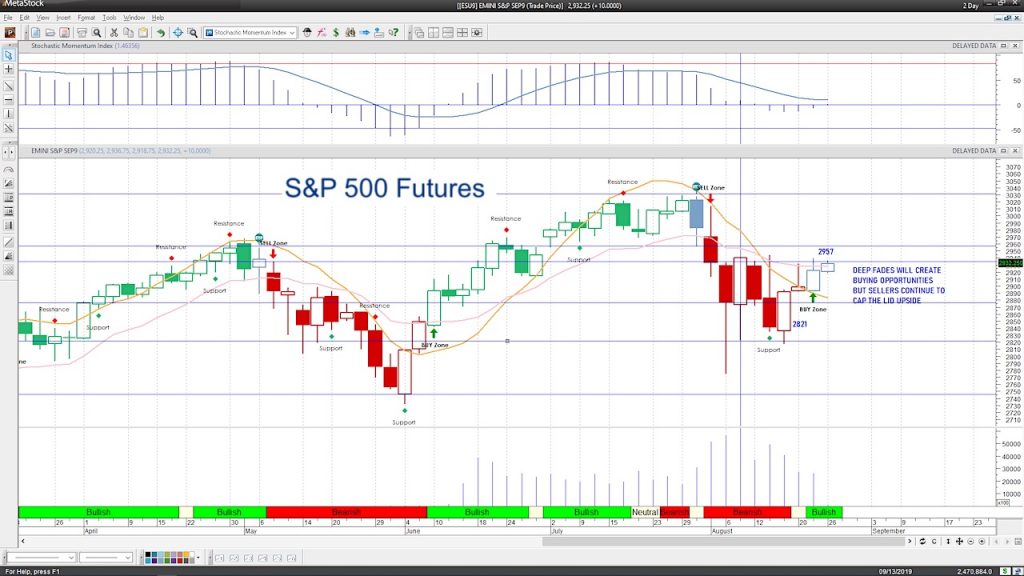
The following is true- The e-mini S&P has broken above congestion but, again without the catalyst, we have to consider that bounces will have a weak probability of holding at the highs.
HOWEVER, we are holding in a place that could break higher quickly before reversing as well as fade steeply before bouncing. The fat line in the sand for resistance remains the region between 2937-2941. If the buyers win this battle, we have another 100 point candle into 3021 that will be formidable resistance at the first pass through. Holding above 2929 will mean the balance of strength has once again swayed to the buyers, for now, but moving above here on light volume implies we don’t have a lot of participation and hence a move downward off those higher edges.
COMMODITY & CURRENCY WATCH
Redux–Gold broke from its high and is now retracing the motion upward yet still holding 1500- key support but continues to look weaker as the market steadies. Technical divergence we’ve seen in the weeks prior is playing out here so I expect a deeper fade to support but that seems to be moving slowly.
Currency risks are still in play. The USD index now holds above 98 and is strengthening the hold above the region. That said, the technical divergence noted could still give us a steep fade creating buying opportunities. WTI is still solidly range bound where buyers are more comfortable at deep support and sellers at higher levels above 57.
INTRADAY MARKET VIEW
DECISION ZONES EVERYWHERE -Ranges hold wider and we hold levels between 2892 and 2946- we tested the lower edge yesterday and are now above 2926-new heavy congestion. The mini Nasdaq is battling the higher edge near 7750 but slipping below. The mini DOW is battling support that was prior resistance -26248. Continue to be careful here on the edges of your charts as we could accelerate out and continue if traders get too heavy on the edges, in which case, you’ll have to reverse your position. For now, they remain reversal regions.
OVERALL WIDE ANGLE MARKET VIEW
Deep support bounces engage –shifting the balance of the traders to a bullish stance into resistance. Weekly charts are showing flattening momentum and some more downside weakness that that must be confirmed. So far, the balance remains with the buyers at value areas.
Twitter: @AnneMarieTrades
The author trades stock market futures every day and may have a position in mentioned securities at the time of publication. Any opinions expressed herein are solely those of the author, and do not in any way represent the views or opinions of any other person or entity.


