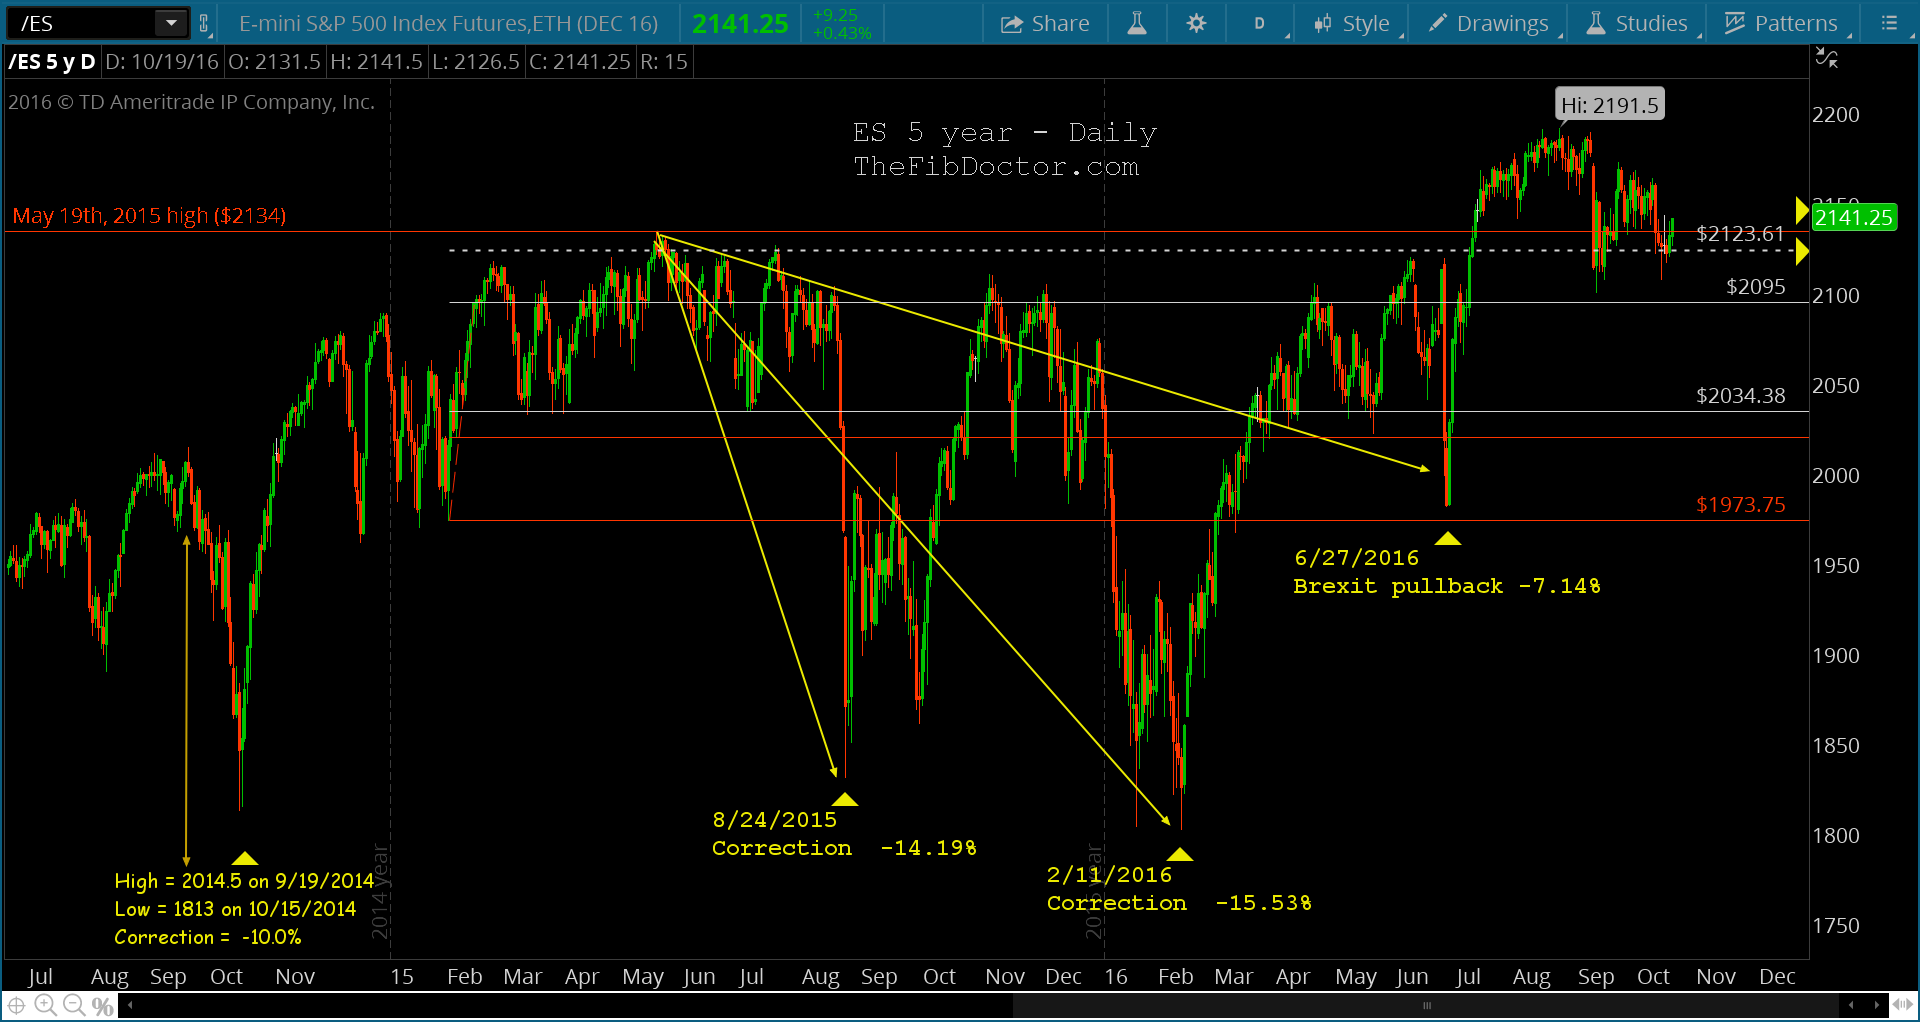
Today I want to share a good long-term chart of the S&P 500 ES futures. Currently, the stock market is receiving support in/around 2123 (prior fibonacci target) and 2134 (prior highs which lasted for over a year).
My prior Fibonacci target was eclipsed by a matter of 11 points in May 2015.
After that top formed, the stock market experienced 2 corrections and a market pullback. After breaking out above the May ’15 highs in July of this year, S&P 500 futures continued up to 2191.5. Now key S&P 500 fibonacci support levels are on watch: 2123, 2095, and 2034.
Best of luck in your trading/investing.
S&P 500 Futures (ES) Long Term Chart
Thanks for reading. Note that you can get more of my trading insights and Fibonacci analysis at Bottom Line Trades.
Twitter: @TheFibDoctor
The author may have a related position at the time of publication. Any opinions expressed herein are solely those of the author, and do not in any way represent the views or opinions of any other person or entity.

: Cup (and Maybe Handle) Watch")
 Trading Near Top Of Price Range")

