The S&P 500 Index has been moving sideways-to-higher since last October. However, this major domestic stock market index has failed to breakout in a meaningful way.
Though the eye test can work for experienced professionals like myself, it’s important to turn to technical price analysis.
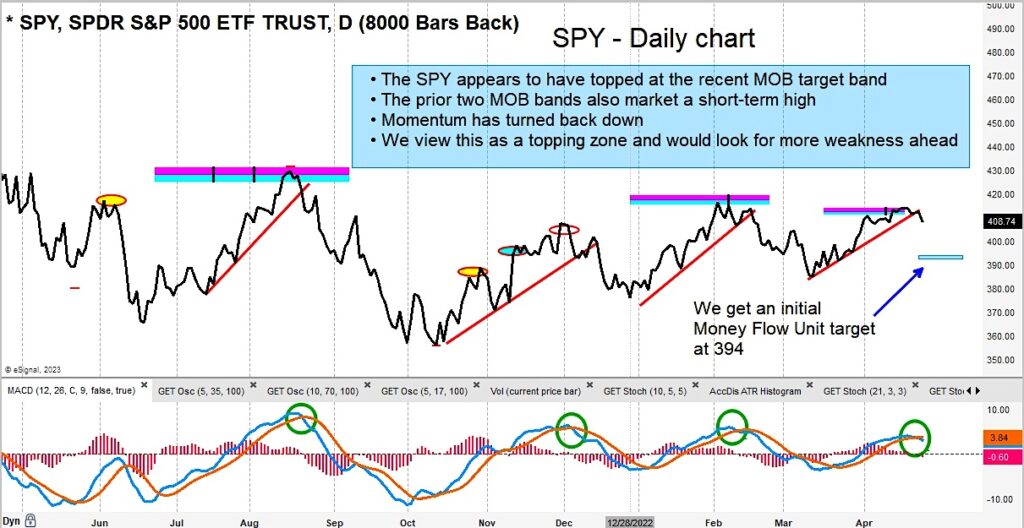
Looking at the chart below, we can see that several technical indicators have been violated.
Sell signals have triggered for price and momentum on a short-term basis. Caution is advised.
In our research, we are seeing continued weakness from a bottom up approach that we use when screening the S&P 1500. Note that this phenomenon has started to manifest itself in a topping process in the S&P 500 ETF (SPY).
My firm calculates an initial MFU target of 394 from here.
$SPY S&P 500 ETF Chart with Price Target
Twitter: @GuyCerundolo
The author or his firm have a position in mentioned securities at the time of publication. Any opinions expressed herein are solely those of the author, and do not in any way represent the views or opinions of any other person or entity.


