Back on August 10, I wrote a post here about the importance of 2200 on the S&P 500 Index (INDEXSP:.INX). It turned out to be a significant price resistance level for the stock market then. And it is once again setting up to be key price resistance level now.
In that post, I wrote the following:
“[I]t’s clear that the S&P 500 is nearing an important price area. A classic AB=CD pattern may be completing.
We want to manage risk and trade about this area because the outcome for “traders” is somewhat binary.”
Following that post, the S&P 500 rose as high as 2193.81 before pulling back to 2083.79 (and lower on the futures market election night). Either way, stock are rallying and 2200 S&P 500 is approaching. Will it hold again?
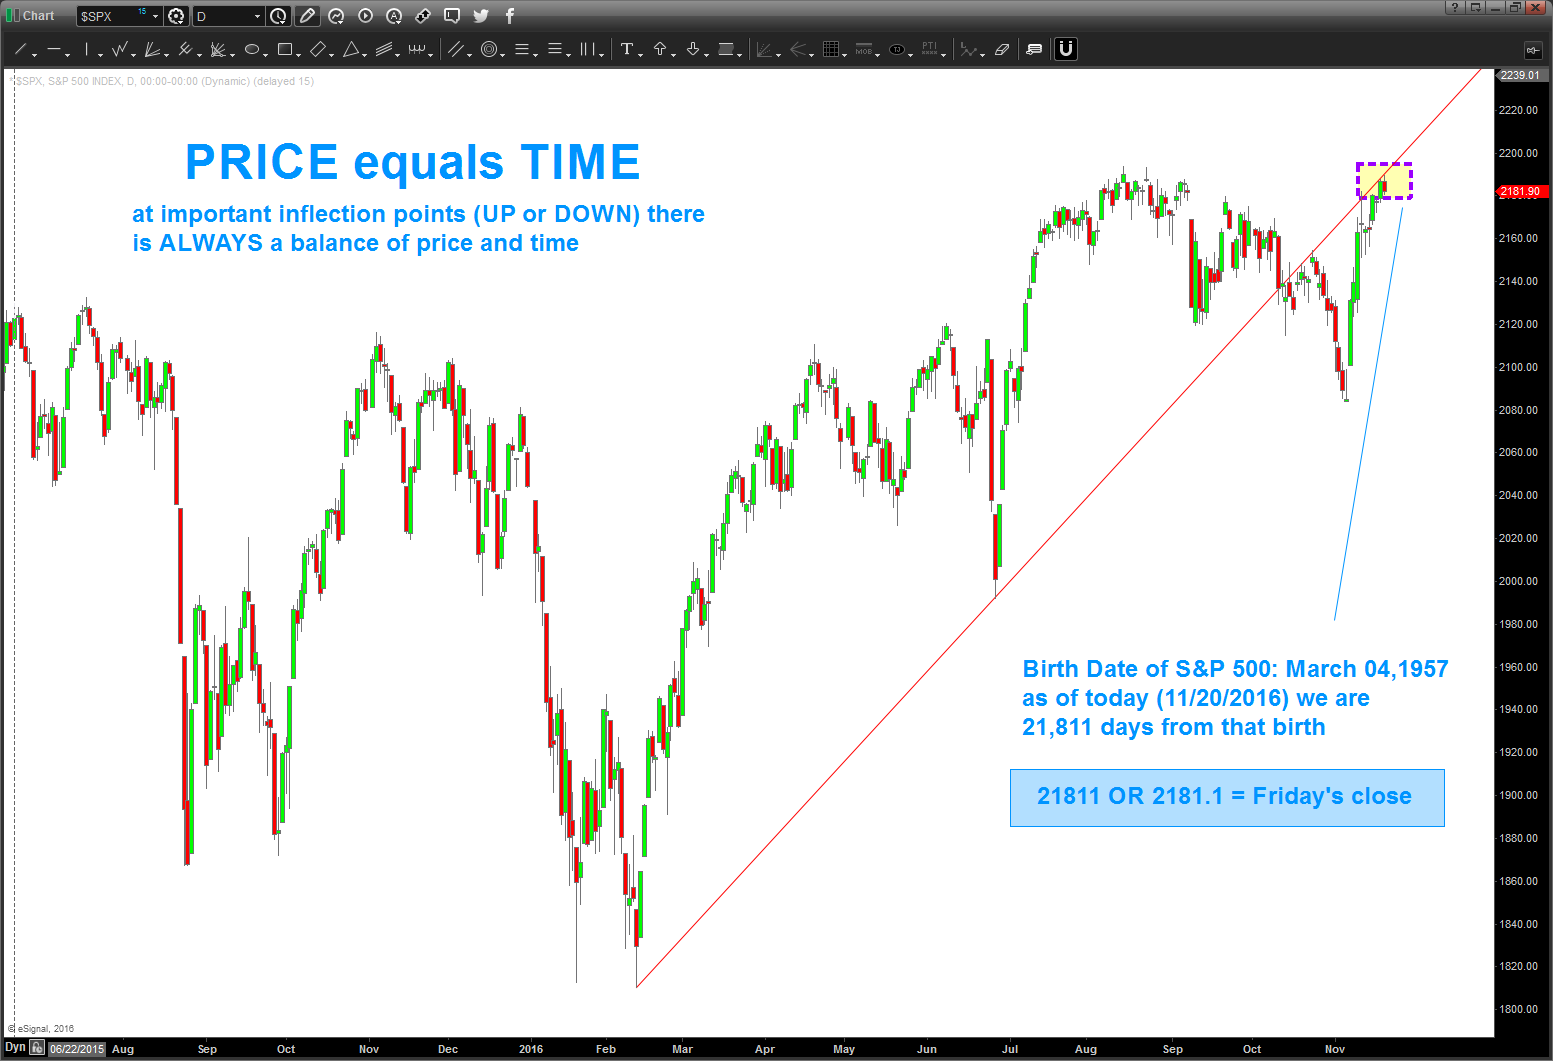
I have no idea. But the numbers and patterns say that time and price are aligning here once more. A breakout above 2200 would be huge for bulls while another rebuff would keep bears alive. Get this: Since the birth of the S&P 500x Indes, 21,811 days have passed. On Friday, the major stock market index closed at 2181.1.
Thanks for reading.
Twitter: @BartsCharts
Author does not have a position in mentioned securities at the time of publication. Any opinions expressed herein are solely those of the author, and do not in any way represent the views or opinions of any other person or entity.


