The market has been in a correction since April. How can that be true given the fact that the S&P 500 and Nasdaq have continued to make new highs in the subsequent months?
Well, there are three types of corrections: price corrections, time corrections and stealth corrections. We are currently experiencing what I would call a stealth correction.
How does a stealth correction work? The major indexes continue to move higher as a relatively small number of mega cap names continue to push to the upside. But under the hood, plenty of stocks are no longer participating in the bullish run.
How can we tell that a stealth correction is taking place? By digging into market breadth indicators.
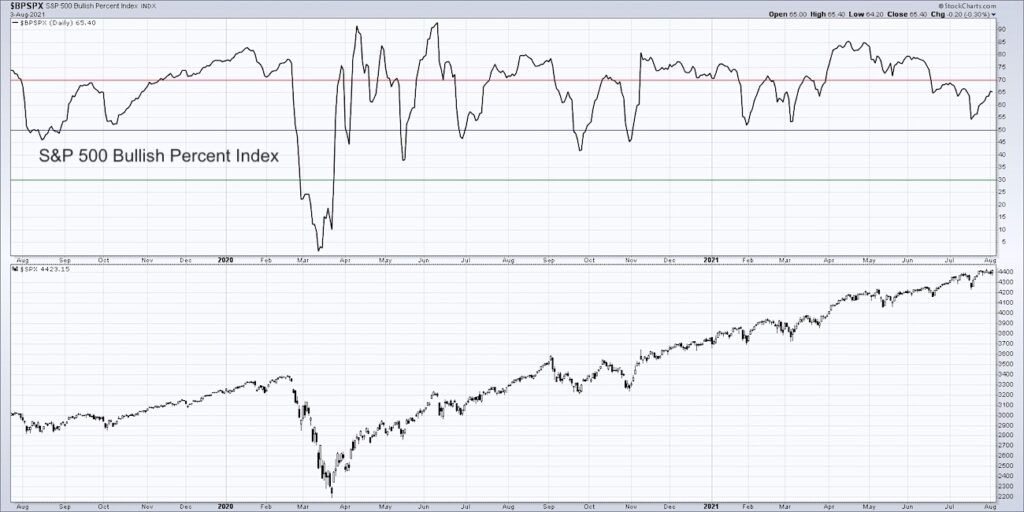
Abe Cohen popularized the use of point & figure charts, a very simple way to plot trends using X’s and O’s on graph paper. He also created what are called “bullish percent indexes”, which are breadth indicators based on those point & figure charts. So while we have the advance-decline lines and other indicators to aggregate the behavior of stocks on bar and candle charts, we have bullish percent indexes to review the performance of index components using their point & figure charts.
In today’s video, we will discuss the S&P 500 Bullish Percent Index, how it’s constructed, and what its current pattern tells us about this stealth correction phase. We will also try to answer the following questions:
– How can we use the Bullish Percent Index to identify internal weakness based on point & figure sell signals?
– How does this breadth indicator relate to others that have flashed warning signs about distribution in the cyclical sectors?
– What does the “bear alert” signal currently in place suggest about the performance of the S&P 500 during the seasonally weakest part of the year?
One Chart [VIDEO]: S&P 500 Bullish Percent Index
S&P 500 Bullish Percent Index Chart
Twitter: @DKellerCMT
The author may have positions in mentioned securities at the time of publication. Any opinions expressed herein are solely those of the author, and do not in any way represent the views or opinions of any other person or entity.


