The S&P 500 (NYSEARCA: SPY) made a new high of 293.94 on September 20th, 2018 but the entire move higher lacked momentum and also leadership.
The monthly RSI was at or nearing 90 which is extreme reading. The S&P 500 (SPY) made a lower high on October 3rd in what turned out to start the brutal move lower during the past week.
Prior to the decline, there seemed to be irrational exuberance from many market participants with some extreme complacency. A few such readings to mention here were the Equity Only Put / Call Ratio ($CPCE) and $VIX to $VXV ratio which were consistently showing complacency.
The question now is whether or not the pain is over for market participants.
Let’s take a look at some charts.
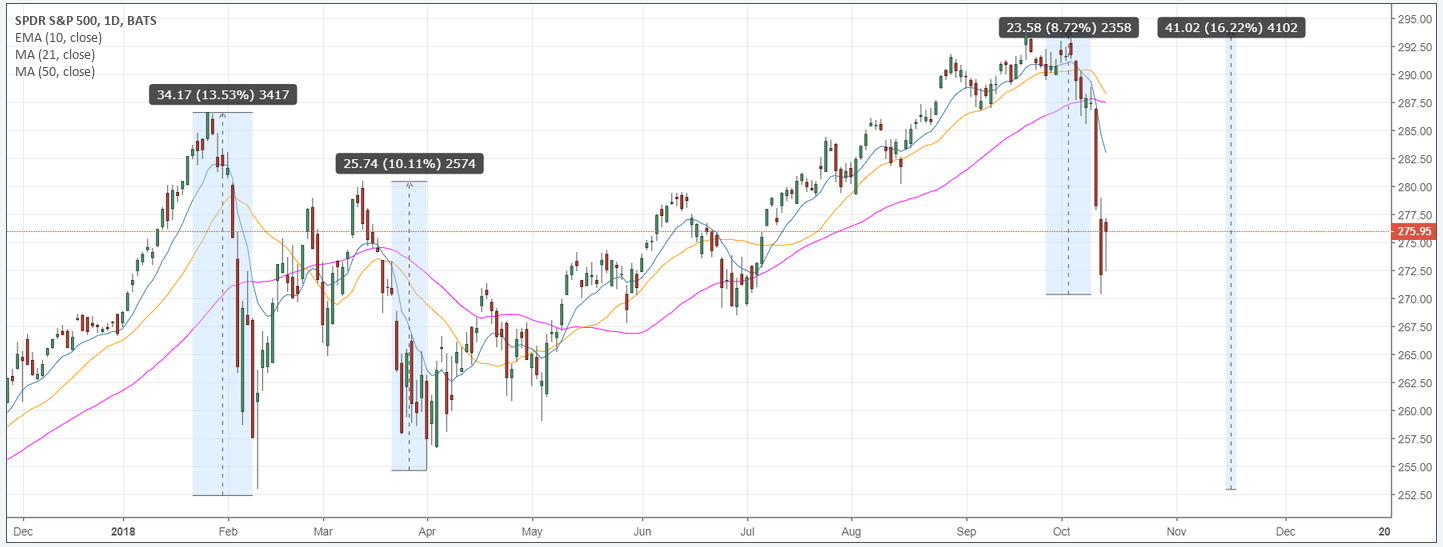
The first chart depicts the percentage decline during 2018 during various corrections. (Courtesy: Brian Shannon – @alphatrends)
- February – 13.53%
- March/April – 10.11%
- October – 8.72% (so far)
Note: If $SPY retests February lows, that will be a 16.22% decline
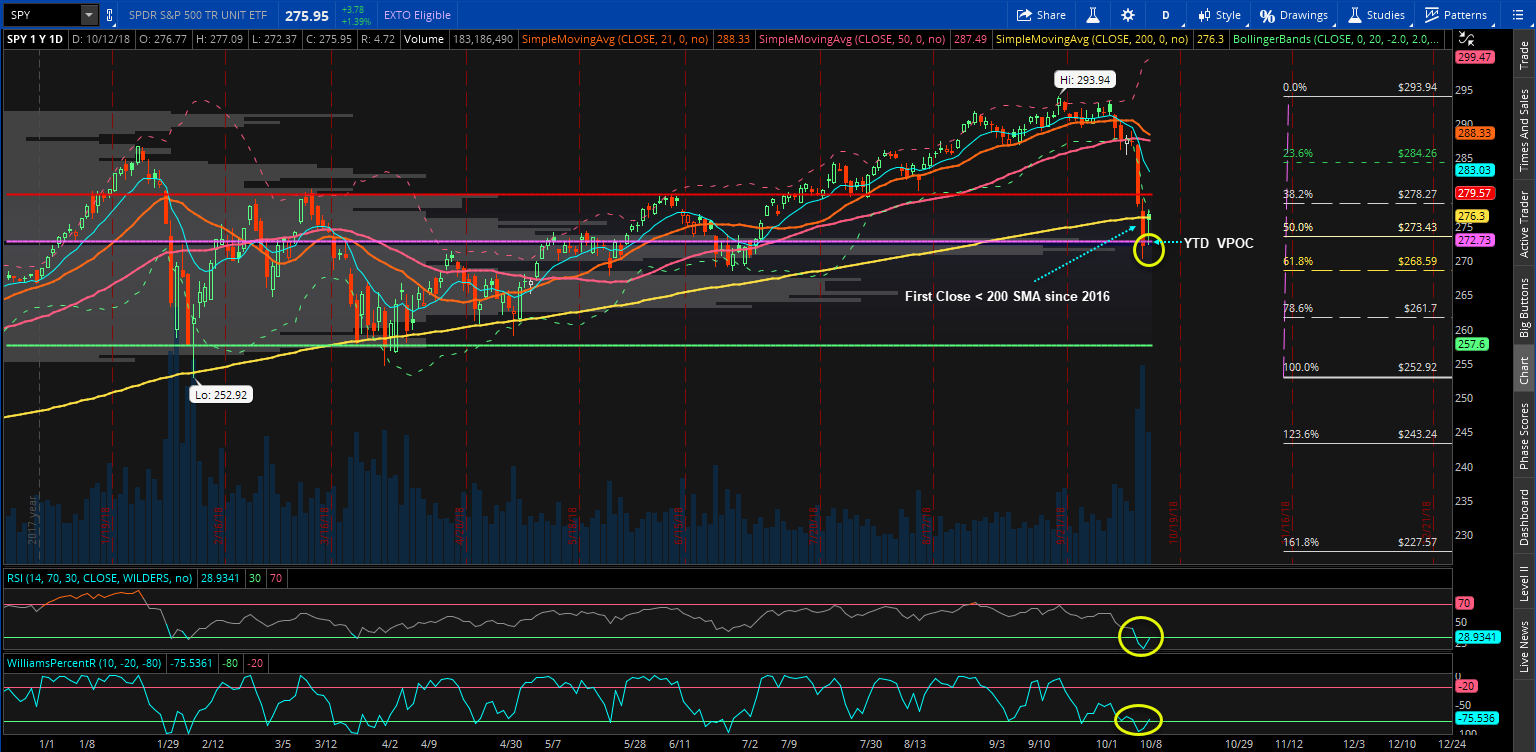
The next chart is the daily chart of S&P 500 ETF (SPY) with Year To Date VPOC.
The current decline from February lows to All Time Highs made in September came close to tagging 61.8% retracement (Fib retracement drawn with weekly chart). The current lows made on October 11th is 270.36 and 61.8% retracement sits at 268.59 which are likely to be tested. Price closed below 200 SMA on this timeframe and this happens to be the first time since 2016.
Additionally, $SPY held the Year to Date VPOC (Virgin Point of Control) at 272.73 for now but closed below the lower Bollinger Bands. On the weekly timeframe, $SPY has held it’s 50 SMA so far.
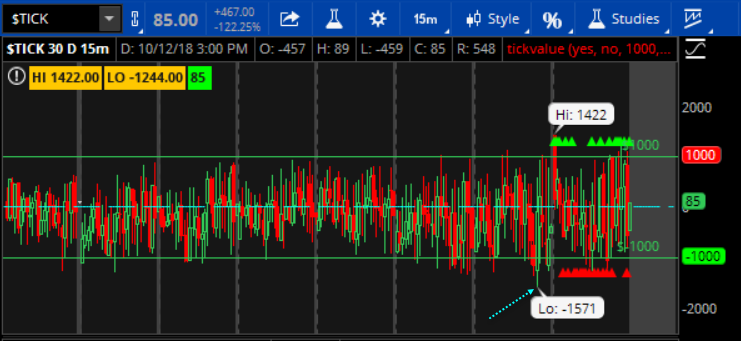
Most of the rallies seen across many years have started with such extreme readings below the 200 SMA and lower Bollinger Bands. Some of the extreme readings to mention were seen in RSI, Williams %R, $TICK. The New Highs vs. New Lows were at nearing
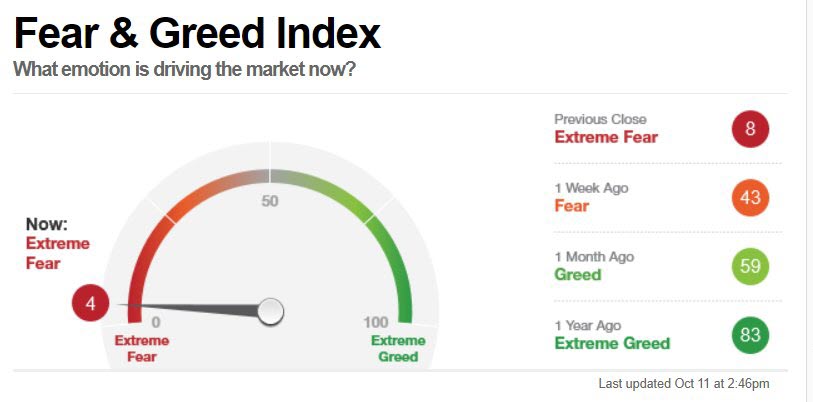
Additionally a sentiment gauge that some of the experienced traders look at is the CNN Fear & Greed. Intraday on October 11th, it had a reading of 4. Bounces occur in the indices at such extreme readings.
Potential Bounce:
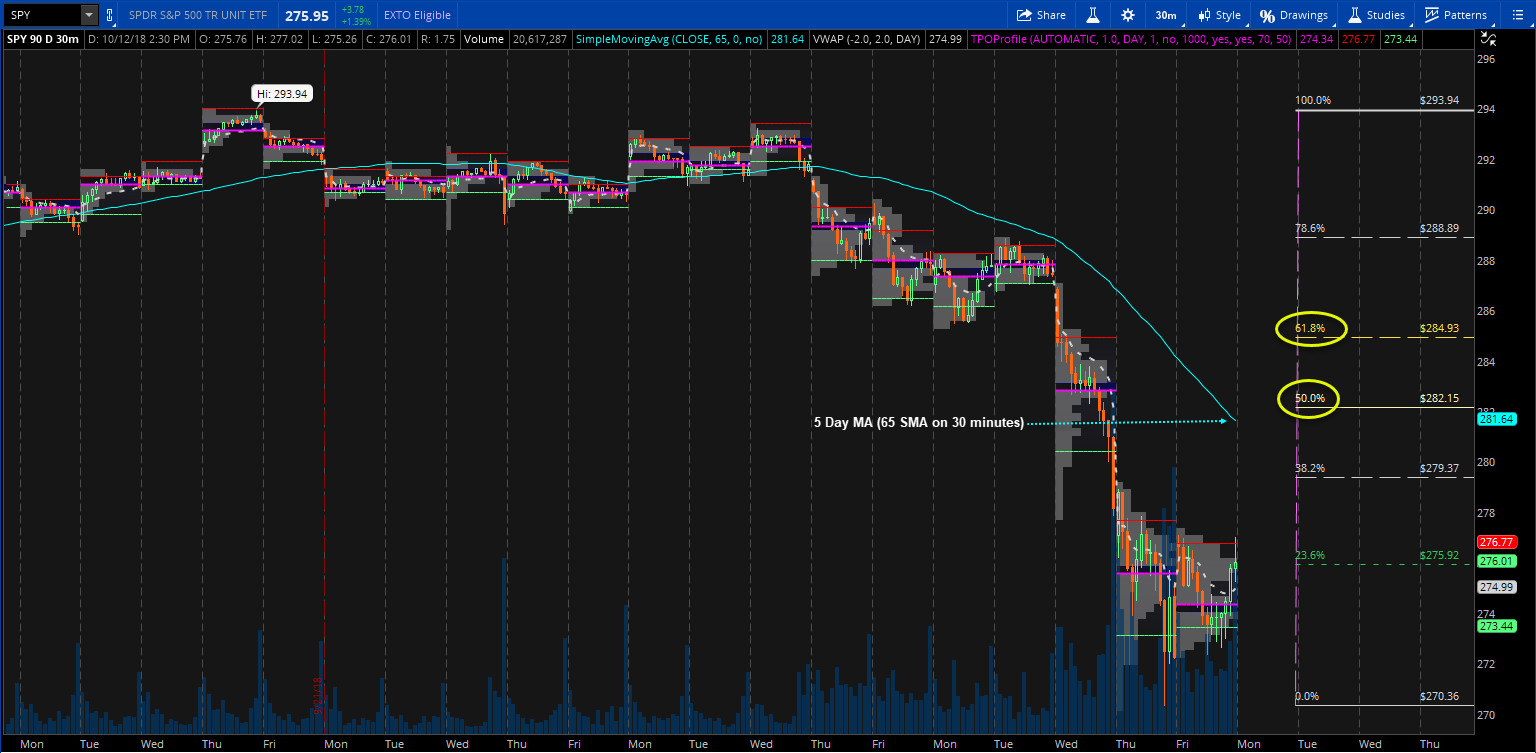
Where do we go from here? Does this bounce continue? Let’s take a look at a few potential levels where this bounce can fail.
- 5 day moving average (65 SMA on 30 minutes) is at 281.64. The posture is declining still and hence this can be the first hurdle to cross.
- 50% retrace from October 11th lows of 270.36 is 282.15. That will be the next level to watch.
- If the above two levels are surpassed, then look at 284.93 which aligns with 61.8% retrace from the October 11th lows.
Final Thoughts: October 11th lows will be visited again some point. Extensive technical damage has occurred in many charts in the shorter timeframe from this move lower. It is prudent for market participants to stay patient and disciplined and manage their position size and their risk.
Note: Author has no position in $SPY or $SPX at this time.
Twitter: @sssvenky
Any opinions expressed herein are solely those of the author, and do not in any way represent the views or opinions of any other person or entity.
")


")
