S&P 500 Trading Outlook (3-5 Days): Bearish on break of 2901
The near-term up-trend gave way again as the S&P 500 closed back under 2901.
The close on the broad stock market index made new 4 week lows.
Technology also broke down from its four-month uptrend, and this is reason to think this decline extends in the short run. That said, downside should be limited to 2775-2800 before stabilizing and bouncing. Tickers: INDEXSP: .INX, NYSEARCA: SPY
S&P 500 Chart
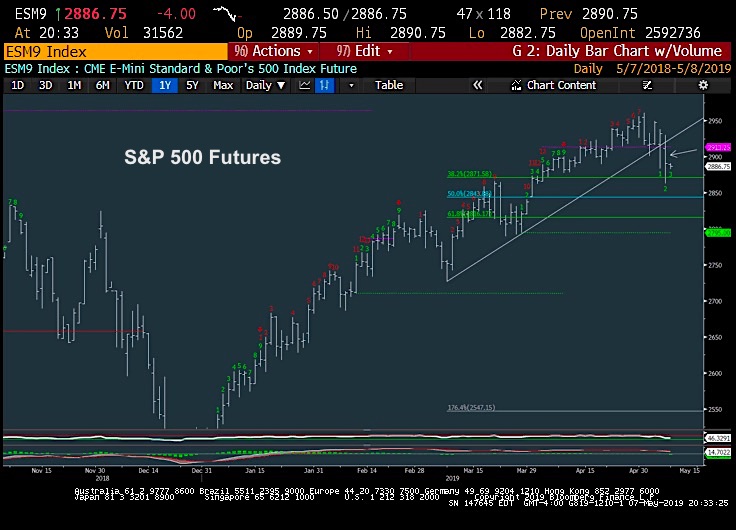
Yesterday’s decline extended under the prior day’s lows, turning trends bearish as prices fell to new multi-week lows. This price action broke a 2-month up-trend in the process.
While the near-term is oversold on the hourly charts, daily momentum is not oversold (RSI=42) and could extend further in the days/week ahead before any bottom.
Overall, getting down to 2840 looks like the first meaningful area on this pullback. Below that would likely bring about a test of 2775-2800, an area that coincides with the 50% retracement of the move from mid-February.
Outside of Equities… Treasuries have extended gains and yields down to 2.447 and a retest of 2.33 looking increasingly likely while German Bund yields look to test former lows from early April near -.10%. The yield curve has begun to flatten again, turning back down to 16.7 on 2/10s while the US Dollar has made fractional gains.
Meanwhile, most precious metals are down with the exception of Gold which looks to largely be a safety trade, along with gains in Japanese Yen, which has moved to 110.23 v USD. Crude oil fell down under 61.50 and while a low here seems close technically, one can’t rule out a bit more weakness to undercut $60 which would bring about trend exhaustion into end of week (Supporting a bounce) Finally, it’s worth pointing out that offshore Yuan is weakening again back to the prior days’ lows, with USDCNH now at 6.80
While a Chinese deal might be right around the corner, uncertainty has begun to rise and Equity markets have begun to show more weakness, finally, some might say, after nearly a month of breadth deterioration. Going forward, it will pay to keep an eye on signs of HIGH TRIN readings (excessive volume in Down stocks vs UP) ,VIX inversion, and some evidence of other Fear. Equity Put/call spiking or signs of exhaustion in VIX on absolute basis.
If you have an interest in seeing timely intra-day market updates on my private twitter feed, please follow @NewtonAdvisors. Also, feel free to send me an email at info@newtonadvisor.com regarding how my Technical work can add alpha to your portfolio management process.
Twitter: @MarkNewtonCMT
Author has positions in mentioned securities at the time of publication. Any opinions expressed herein are solely those of the author, and do not in any way represent the views or opinions of any other person or entity.


