One my favorite ways to measure market breadth is to look for confirmation from indexes covering different parts of the equity markets.
This is based on the foundational work of Charles Dow, who wrote in the early 1900’s about the importance of the stock market “averages confirming each other.” While this is often done using the Dow Industrials and the Dow Transports, I’ve found you can use this methodology with many different combinations of stock market indices.
Confirming Cap Tiers
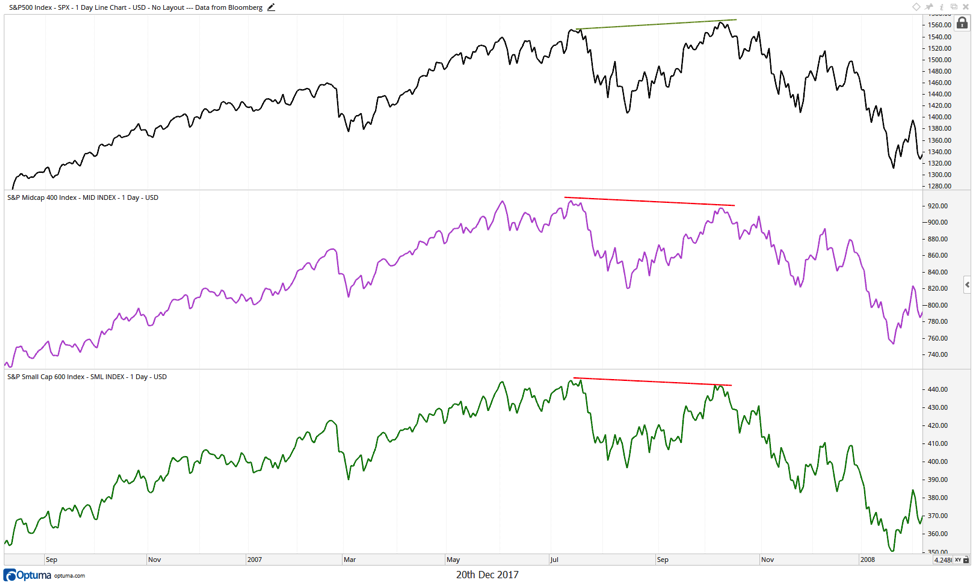
Toward the end of a bull market, you’ll find smaller companies starting to break down earlier than larger companies. As investors sell out of smaller, more speculative names, the mid cap and small cap stock indices start to sell off. The larger, more conservative blue chip names in the large indices continue to trade higher as investors flock to safety.
As a result, the main benchmarks (S&P 500, Dow Industrials) appear to be in fine shape, while the other indices start to show signs of weakness. For example, here are the large, mid, and small cap stock indices at the 2007 market top. Notice how the S&P 500 continued to new highs, while the S&P MidCap 400 and S&P SmallCap 600 both failed to achieve higher highs.
How has this comparison looked more recently?
In October, we saw large cap stocks trading to new highs, mid cap stocks essentially trading sideways, and small cap stocks actually trading lower (orange arrows).
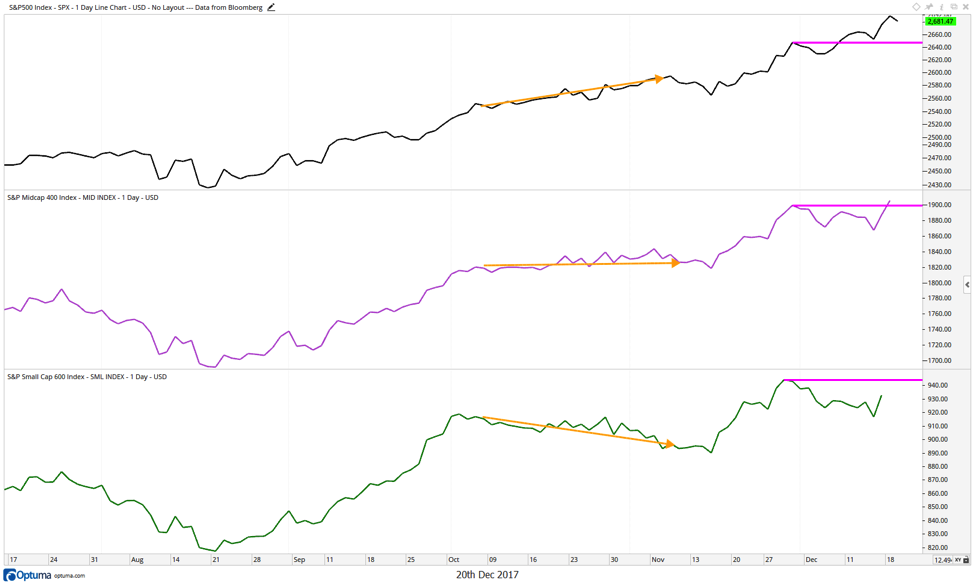
Just before Thanksgiving, this divergence was resolved as all three indices finally moved to new highs.
In the last three weeks, we have seen another divergence. Large cap stocks (led by technology and financials) have moved to further closing highs, while the mid cap and small cap indices have failed to do so.
Just this week, the S&P 400 MidCap index closed at a new high, leaving the S&P 600 SmallCap index as the remaining holdout. If and when small cap stocks break out to new closing highs, this would confirm further upside for US equities.
You can gain deeper insights and more meaningful analysis over at Sierra Alpha Research.
Twitter: @DKellerCMT
The author does not have a position in mentioned securities at the time of publication. Any opinions expressed herein are solely those of the author, and do not in any way represent the views or opinions of any other person or entity.

: Showing Some Signs of Emerging Strength")
