THE BIG PICTURE – What’s Ahead?
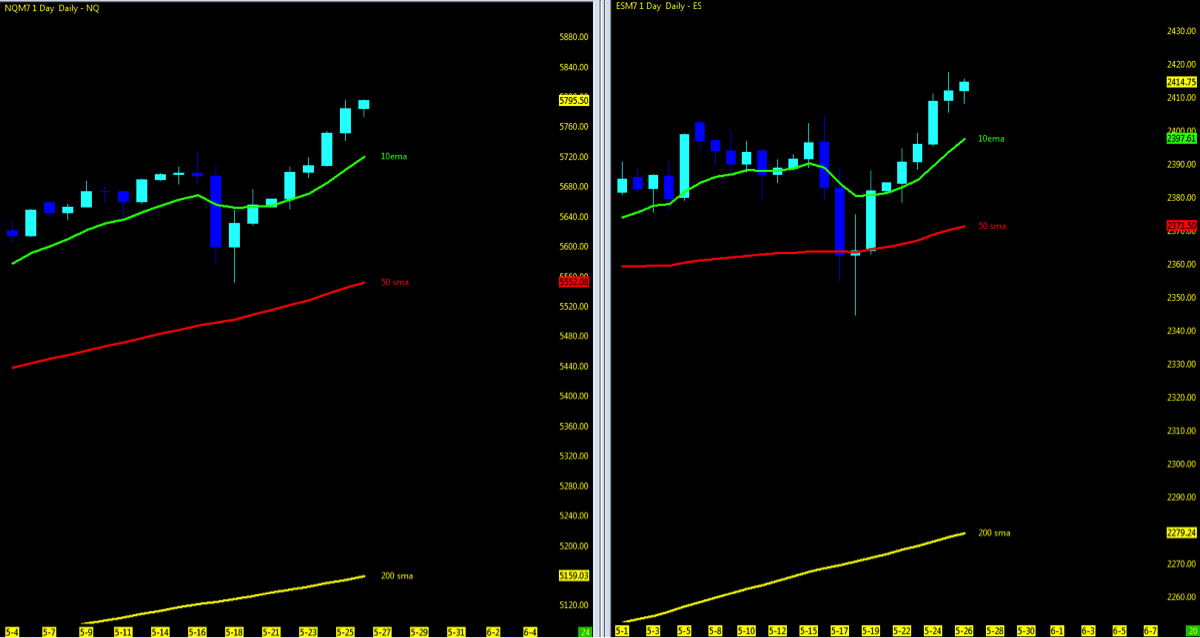
Key stock market futures indices held and closed above their weekly open, with the Nasdaq futures (NQ) and S&P 500 futures (ES) making new all time highs in week 21. This comes even while the Dow Jones and Russell 2000 continue to lag.
Either way, the Nasdaq (INDEXNASDAQ:.IXIC) and S&P 500 (INDEXSP:.INX) maintain a relentless uptrend, holding above the short term 10 and mid-term 50 period moving averages.
Nasdaq & S&P 500 Futures “Trend” Charts
Tech industry/FANG stocks under the umbrella of the Nasdaq futures (NQ), appear to be leading the fight upside. Surely the iconic “sell in May and go away” is not playing out well for those who enjoy the cyclic events in the market.
On the Macro view to the market, I leave it to the likes of KennyPolcari, MrTopStep and Jason Kelly who seem to cover just enough materials for me to read each day and provide me with a quality high level look at the fundamentals for my trading overview. From there, I turn to the technicals. And, by keeping it as simple as moving averages and MML levels, I am able to define where the highest probability is for a continued trend or pullback.
Volume in week 21 was light, so I remain a bit cautious into week 22 (I would like to see a follow through with price and volume rising together). If we do see a pullback, we’ll want to eye the open gaps made in week 21 as points of reference, including the 10 day moving average.
Looking at the MML levels on the higher time frames: price action is at the ZONE HIGH on the Nasdaq and Dow Jones and the S&P 500 has probability on its side to reach the MML Zone high soon.
Key events in the market this week include fed speakers, end of month, JOLT’s and Payroll numbers. Holiday weekend with no session on Monday as the June contract expiration nears.
Note that you can also view my market outlook on YouTube. Markets Covered: ES, YM, NQ, GC, CL, 6J, 6E
THE BOTTOM LINE
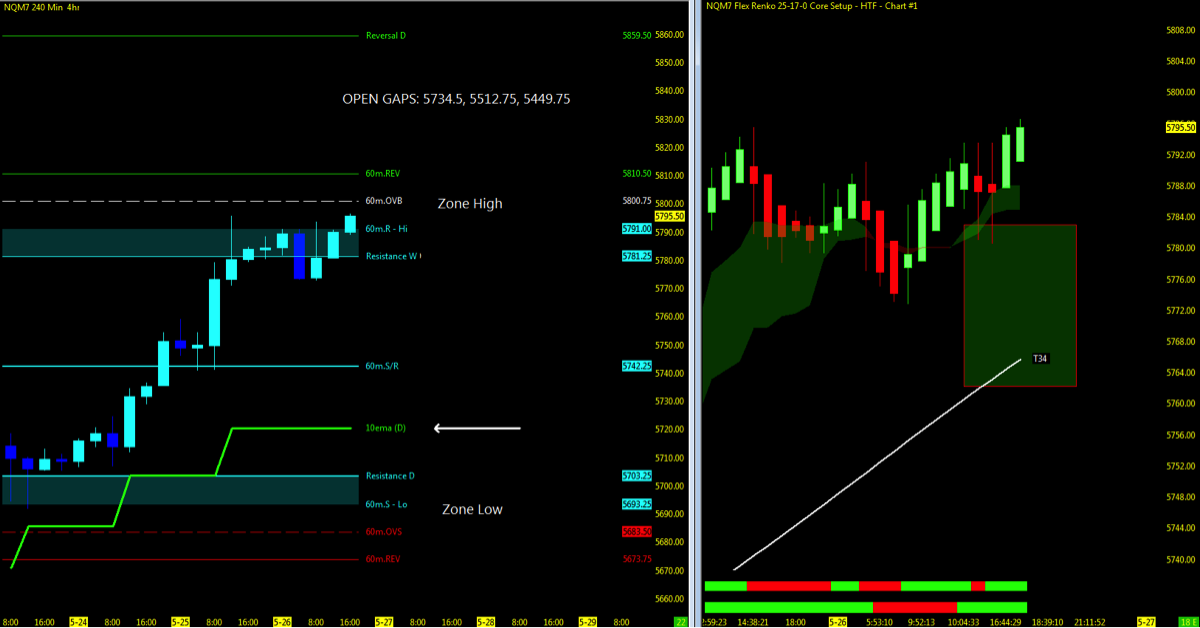
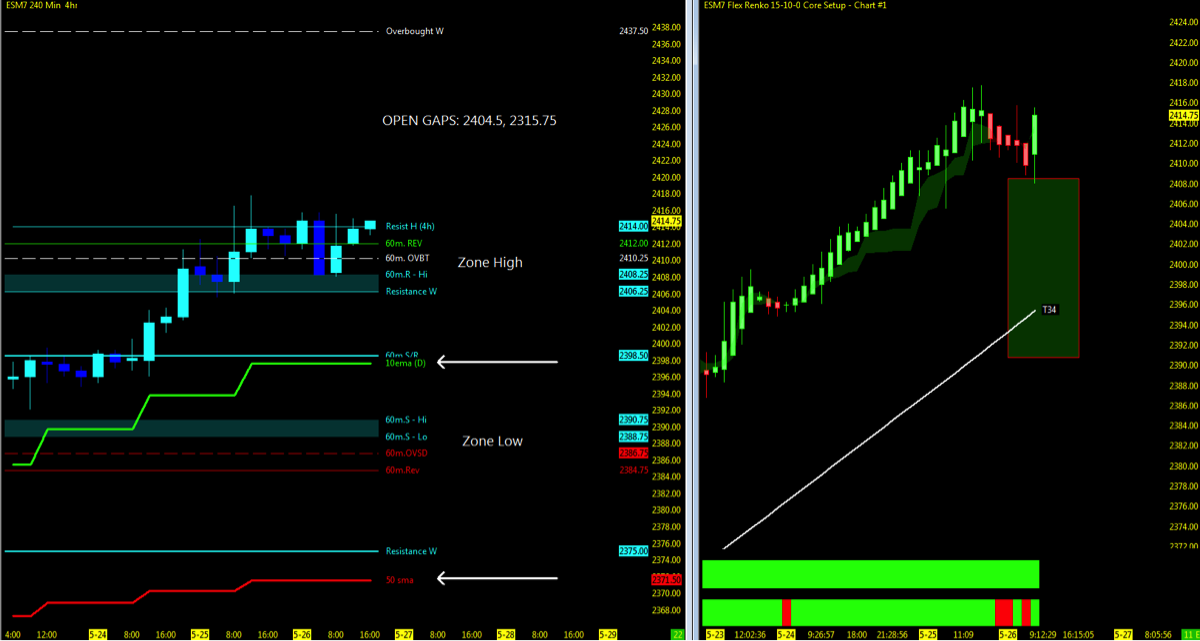
NQ/ES sitting well above the T34ema on the higher time frame range chart holds the current momentum upside as the YM struggles to maintain pace. Downside action will test the T34ema support and daily 10ema including open gaps from week 21 and MML Zone Low. Deeper pullbacks will test the daily 50ema. Momentum to the upside continue to monitor higher lows and highs and 60m MML levels. Employment numbers in the later part of the week will be the ones to watch.
I will provide updates through social media and via my daily outlook; posted 30 minutes prior to the US open of any updates throughout the week.
Nasdaq Futures (NQ)
Technical Momentum: UPTREND
Using the Murray Math Level (MML) charts on higher time frames can be a useful market internal tool as price action moves amongst fractal levels from hourly to daily charts. Confluence of levels may be levels of support/resistance or opportunities for a breakout move.
Multiple MML Overlay (4hr with 60m/Daily/Weekly and Range)
- Nearest Open Daily Gap: 5734.5, 5512.75, 5449.75
- Lowest Open Gap: 4017
S&P Futures (ES)
Technical Momentum: UPTREND
Multiple MML Overlay (4hr with 60m/Daily/Weekly and Range)
- Nearest Open Daily Gap: 2404.5, 2315.75
- Lowest Open Gap: 1860.75
Thanks for reading and remember to always use a stop at/around key technical trend levels.
Twitter: @TradingFibz
The author trades futures intraday and may have a position in the mentioned securities at the time of publication. Any opinions expressed herein are solely those of the author, and do not in any way represent the views or opinions of any other person or entity.


