Global financial markets have stabilized on the assumption that the Omicron covid variant is less aggressive than feared and that economic recovery may not be in danger.
We have seen a nice recovery in global stocks and stock markets, with the S&P 500 index approaching all-time highs while the German DAX is eyeing the 16000 price level.
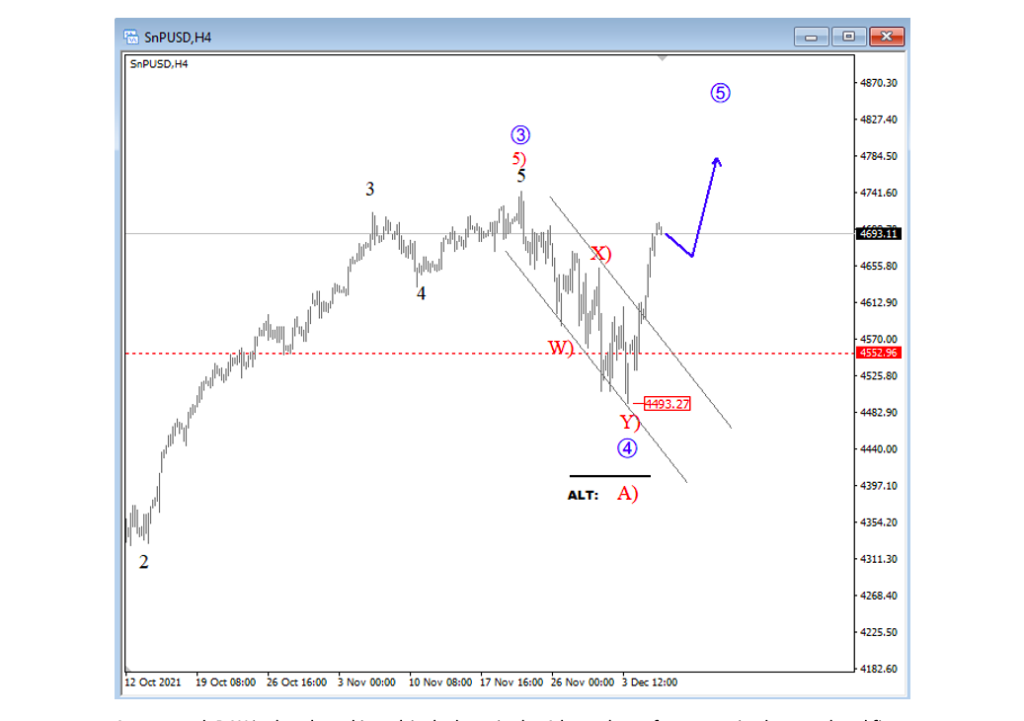
On the U.S. index we see a nice strong recovery. A clear Elliott wave impulse has developed meaning that more upside can be expected… perhaps after a small pullback. This pullback could also be bullish for commodity currencies as the US Dollar may have a hard time breaking above its resistance. Be aware that price support on the S&P 500 is at 4640-4670.
Elliott wave analysis highlighted what appears to be a rally out of a corrective wave 4. It’s currently in a strong and impulsive rally, ideally back to highs for wave 5. At the same time that we need to be aware of more upside, keep an eye out for short-term pullbacks and watch the 4493 level. Note that the previous decline from the highs can also be an alternative wave (A), so any sudden strong decline would be a signal for a more complex correction.
S&P 500 4-hour Chart – Elliott Wave Analysis
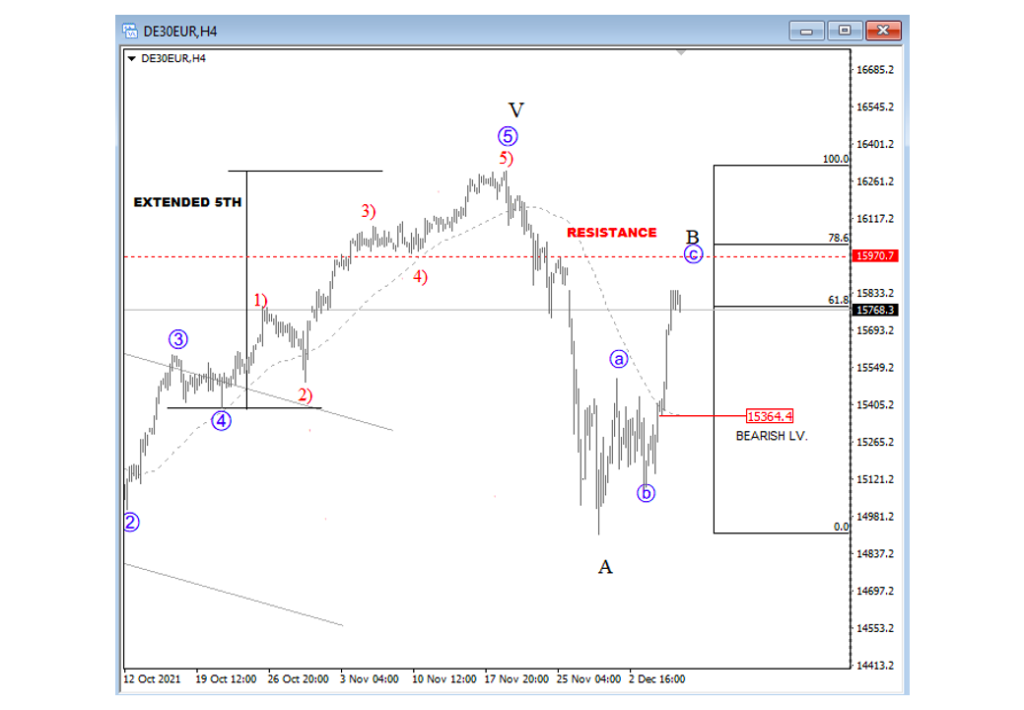
As expected, the German DAX is sharply and impulsively down on the 4-hour chart after completing a five-wave bullish cycle from 14800 to 16400. So, it seems like a new, higher degree A-B-C corrective decline is now in progress on a daily chart. This decline can send the price even lower, ideally back to the former wave 4 price support zone around 14800. The index is approaching strong resistance in the 15800 – 16000 area. A sharp reversal down from here would confirm our view for wave C. Be patient.
DAX 4-hour Chart – Elliott Wave Analysis
Twitter: @GregaHorvatFX
The author may have a position in the mentioned securities at the time of publication. Any opinions expressed herein are solely those of the author, and do not in any way represent the views or opinions of any other person or entity.

: Worrisome to Broader Market?")

