Stocks have rallied off the late December market lows and investors are breathing a sigh of relief.
As the market was declining, more and more investors jumped ship.
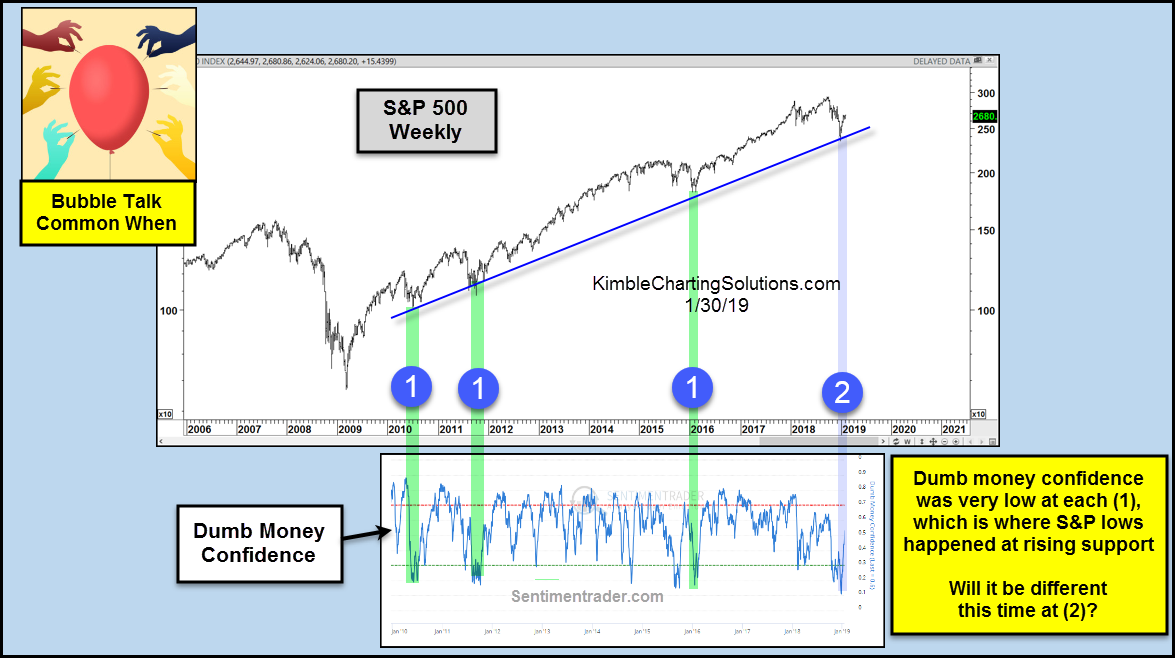
This is a common theme during corrections. To illustrate this, we look at a chart of the S&P 500 Index (INDEXSP: .INX) with corrections since the 2009 bottom. The chart also has a graph of dumb money confidence from Sentiment Trader.
As you can see, dumb money has been in decline over the past several months. And while dumb money was scared, bubble talk was easy to find in the news and on social media.
As well, 9-year trend line support on the S&P 500 Index was hit at the same time that dumb money confidence hit new lows – at point (2).
It’s also worth pointing out that the past 3 times the S&P 500 hit trend line support this confidence barometer was at similar levels.
Will the results be any different this time?
S&P 500 “Weekly” Chart
Note that KimbleCharting is offering a 2 week Free trial to See It Market readers. Just send me an email to services@kimblechartingsolutions.com for details to get set up.
Twitter: @KimbleCharting
Any opinions expressed herein are solely those of the author, and do not in any way represent the views or opinions of any other person or entity.


