 By Andrew Nyquist
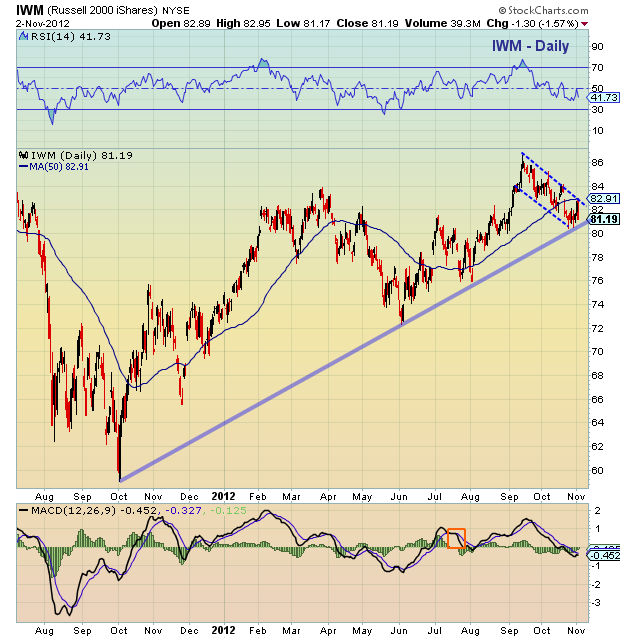
Relative underperformance on the Russell 2000 (IWM) was a leading indicator of internal weakness as the markets were topping in September. Since that juncture, the small caps have continued to struggle, channeling lower for the past 7 weeks.
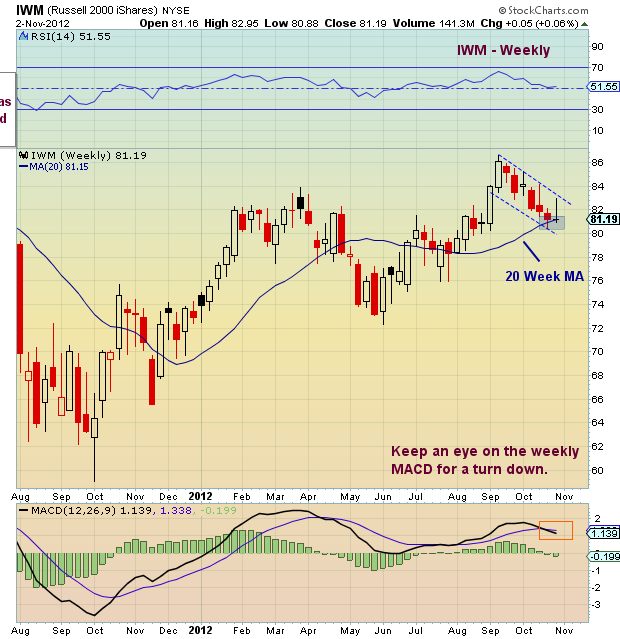
But on both the daily and weekly bar charts, the IWM is nearing a critical juncture. On both charts the IWM is nearing its 1 year uptrend line and on the weekly chart in particular, the index is resting on its 20 week moving average. As well, the weekly chart is at risk of turning its MACD down, which would be a red flag on an intermediate term basis.
The next week or two should be telling. Trade safe, trade disciplined.
More charts found here.
Russell 2000 iShares (IWM) stock charts as of November 2, 2012. Russell 2000 charts with important support levels and trend lines. IWM technical analysis for November.
———————————————————
Twitter: @andrewnyquist and @seeitmarket Facebook: See It Market
No position in any of the securities mentioned at the time of publication.
Any opinions expressed herein are solely those of the author, and do not in any way represent the views or opinions of his employer or any other person or entity.


