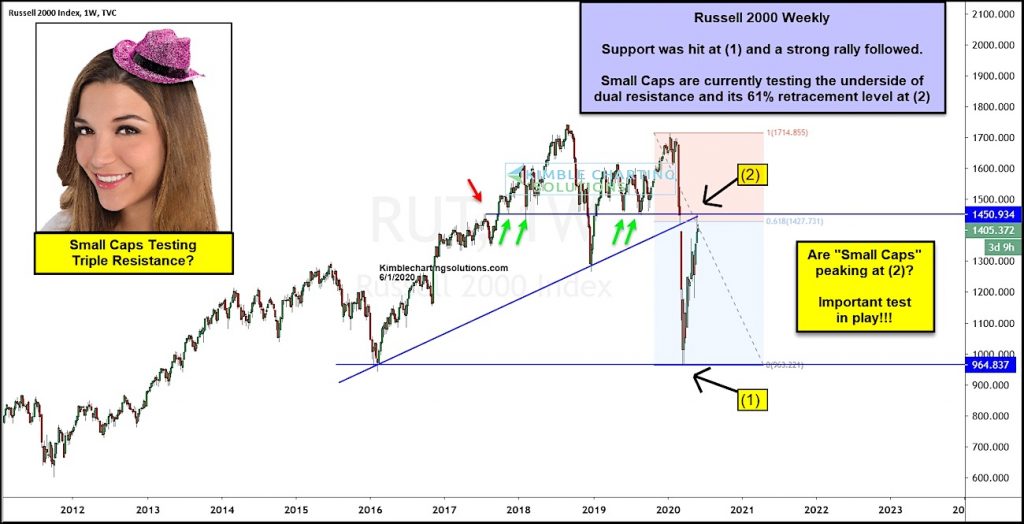
Russell 2000 Index “weekly” Chart
The Russell 2000 Index INDEXRUSSELL: RUT lagged the broader S&P 500 Index for much of the recovery rally off the March lows.
But recently, the small caps stocks index has joined the fun. But the question is, can it last?
In today’s chart, we highlight a very important level to watch on the Russell 2000.
As you can see, the index is rallying right into triple resistance at (2), marked by a broken up-trend line, 61.8 Fibonacci price level, and former support (see green arrows).
Could the small caps rally peak out at (2)? Or breakout? There is a potential inflection point in play. Stay tuned!
Note that KimbleCharting is offering a 2 week Free trial to See It Market readers. Just send me an email to services@kimblechartingsolutions.com for details to get set up.
Twitter: @KimbleCharting
Any opinions expressed herein are solely those of the author, and do not in any way represent the views or opinions of any other person or entity.

: Showing Some Signs of Emerging Strength")

