Silver has delivered both excitement and anxiety— surging higher in a volatile run and then stunning traders with a dramatic one-day selloff.
Since that shakeout, the metal has begun to stabilize, moving into a period of consolidation that could define its next major trend.
While the price action has been intense, the bigger picture for silver remains constructive.
The underlying fundamentals continue to lean bullish, with supply constraints and steady industrial and investment demand supporting the longer-term outlook.
In other words, the recent volatility has not changed the core story — it has simply reset expectations and levels.
Now that silver is calming down, this is where strategy comes into play.
Consolidation phases often create the best opportunities to develop a clear trading and investment plan rather than reacting emotionally to sharp moves.
Watch the video here: https://youtube.com/shorts/HSgIt9uG1T8?si=eYkQE_1s8L3MqW8h
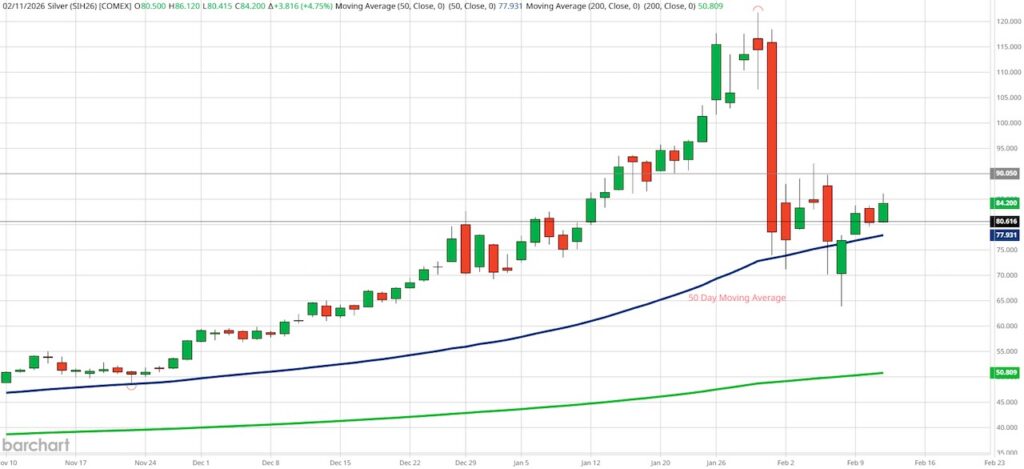
The key technical level to watch on the downside is $80, which now becomes an important support zone. Holding above that level keeps the current bullish structure intact.
On the upside, a decisive move over $90 an ounce could signal renewed momentum and attract fresh buying interest. If that breakout occurs, silver has the potential to run back toward $110 or even higher over time.
As always, in Mish’s Market Minute, price leads the narrative — and silver’s next chapter will be written by how it behaves around these critical levels.
In this video, topics covered:
- Silver’s recent volatility and sharp selloff
- Why the bullish supply–demand story remains intact
- What consolidation means for traders and investors
- Key support level to watch: $80
- Breakout trigger: above $90
- Potential upside target: $110+
Video https://youtube.com/shorts/HSgIt9uG1T8?si=eYkQE_1s8L3MqW8h
Note that this is different than our other YouTube channel featuring the Economic Modern Family.
That is for financial literacy.
Mish’s Daily of Mish’s Market Minute on the MarketGauge YouTube channel under “shorts” is meant for the more serious self-directed investor.
They do, however, overlap.
Stock Market ETFs Analysis and Summary:
(Pivotal means short-term bullish above that level and bearish below)
S&P 500 (SPY) Back to bullish phase and near the highs-critical next moves
Russell 2000 (IWM) Failed 267 which might be a bit concerning
Dow (DIA) 49,600 needs to hold
Nasdaq (QQQ) 620 puts this back over the 50-DMA but under 610 again will be trouble
Regional banks (KRE) Sold off a bit so now has to hold around 70.00
Semiconductors (SMH) sister semis is back in the game with all time high 420
Transportation (IYT) 79 has to hold
Biotechnology (IBB) Good consolidation probably means higher in store if holds 170
Retail (XRT) Granny in an unconfirmed warning phase-if gets a second close under 88 could be concerning
Bitcoin (BTCUSD) 58k is the 200-week moving average. 72,500 place to clear and the good news is that the high volatility has cooled off some
Twitter: @marketminute
The author may have a position in mentioned securities at the time of publication. Any opinions expressed herein are solely those of the author and do not represent the views or opinions of any other person or entity.


