There are some signs that biotech wants to get moving here, making it an important sector to watch in the coming days and weeks.
Before we get into some charts and indicators, let’s compare two of the more popular Biotech ETF’s: SPDR S&P Biotech (XBI) and iShares Nasdaq Biotechnology (IBB). Here they are, by the numbers:
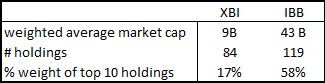
As you can see, the IBB is more concentrated on large and mega-cap names, while XBI is broader and focused on all market cap sizes.
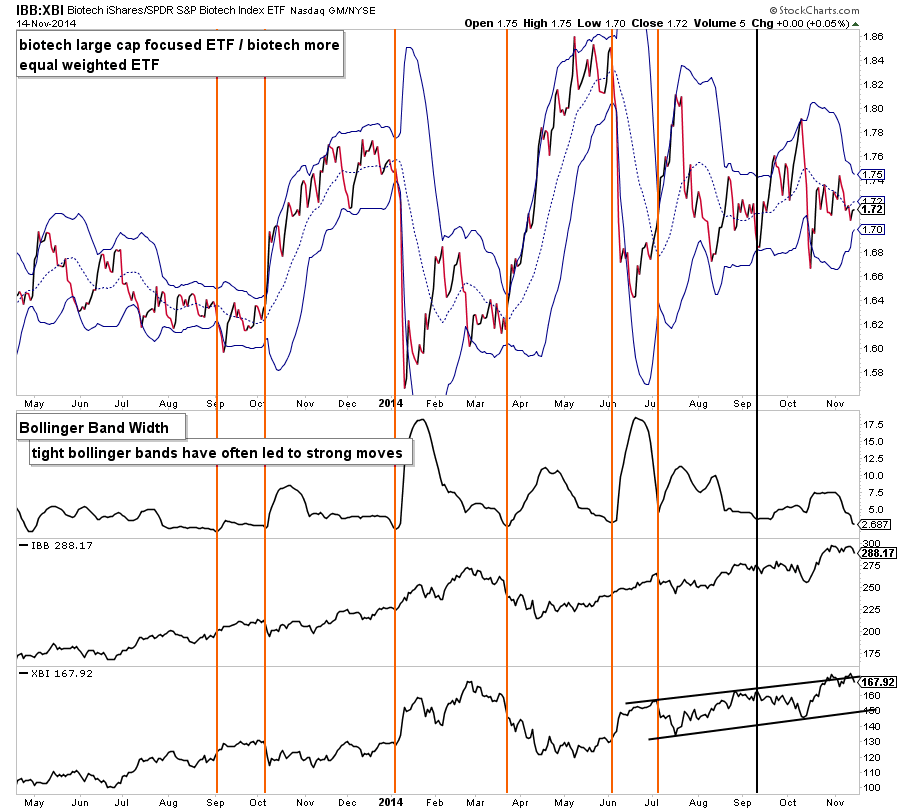
A ratio of the two ETF’s is plotted in the chart below. Over the last 14 months, when the Bollinger Bands on this ratio have gotten very tight, a sharp short-term move in the biotech sector has often followed. Currently, the bands are as tight as they have been all year. It’s not a stretch to say a ‘trending’ sharp move is coming.
Now let’s dig into each ETF individually
XBI (S&P Biotech SPDR)
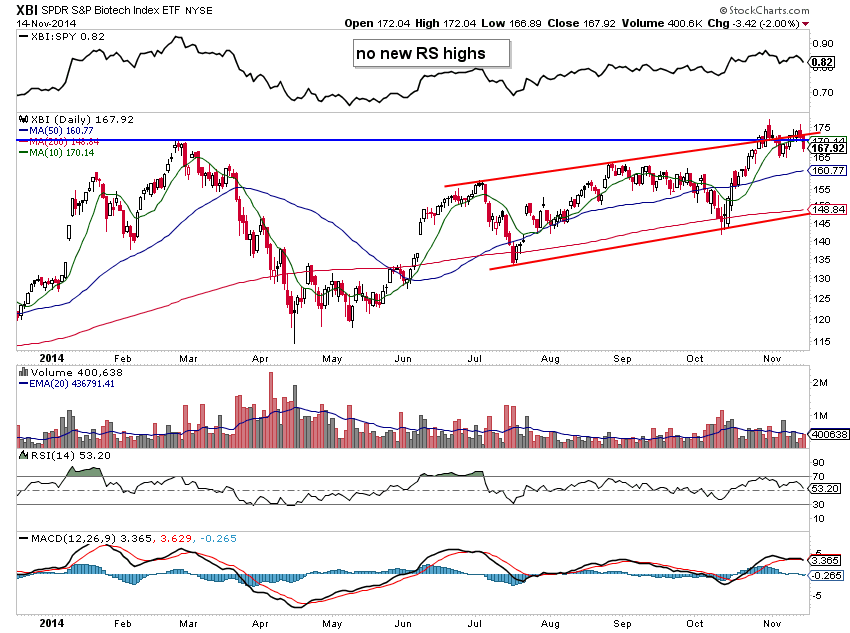
Looking at the XBI, it’s overshot the March highs and an upper channel boundary. Now after falling back into the channel, there is a chance this will retest the bottom side at the 200 day moving average.
Note it still hasn’t made a lower low and we’re getting ahead of ourselves until it does. In fact, there is a possible positive RSI reversal.
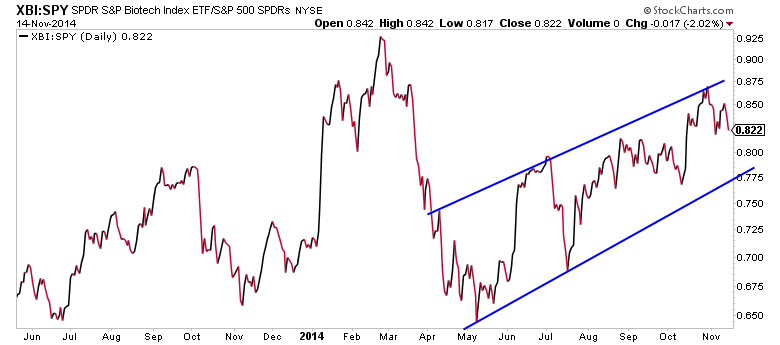
Now let’s take a look at another way to gauge relative strength: looking at the ratio of XBI relative strength compared with the SPDR S&P 500 (SPY). Here you can see that XBI:SPY has failed to reach highs with price and also appears to be trading within a corrective channel. This is where we develop a sense of folks piling into the market.
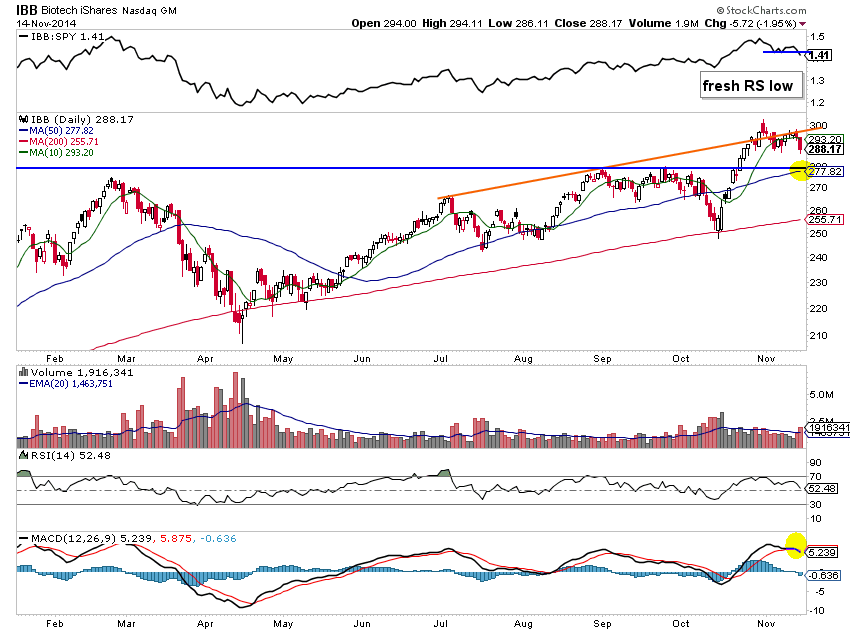
IBB (Biotech iShares)
After recently ripping above it, IBB is respecting its upper boundary line (formed by connecting the prior two peaks). Price is nearing a support zone, but momentum and relative strength are breaking to new short-term lows. As well, the rising 50 day moving average and September highs confluence makes for an important price zone.
Looking at the March to October base, we see a flawed cup with handle that is susceptible to false breakouts. This makes the 275-280 area even more important!
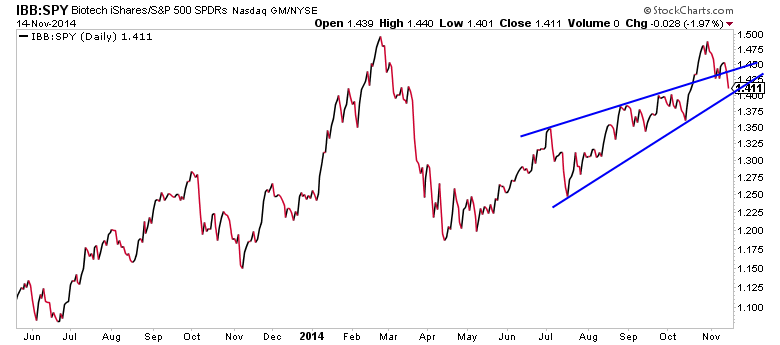
Digging into IBB’s relative strength, we see a rising wedge pattern that broke higher and is now back within the wedge. Was that move a blow-off? Note the potential support line nearby. If that area doesn’t hold, we could see meaningful underperformance from the group into the end of the year.
To summarize, we do get the sense that the group is ready to move and is showing some signs of exhaustion. But that doesn’t mean the rally can’t continue. Thanks for reading!
Follow Aaron on Twitter: @ATMcharts
No position in any of the mentioned securities at the time of publication. Any opinions expressed herein are solely those of the author, and do not in any way represent the views or opinions of any other person or entity.


