Last year’s stock market decline was punishing and no one was hit harder that tech and growth stocks… and leadership groups like the Semiconductors.
What leads on the way up often leads the way down in bear markets.
BUT, the Semiconductors are trying to change their fortune, and perhaps the fortunes for the broader market!
“The facts, Ma’am. Just the facts.” – Joe Friday
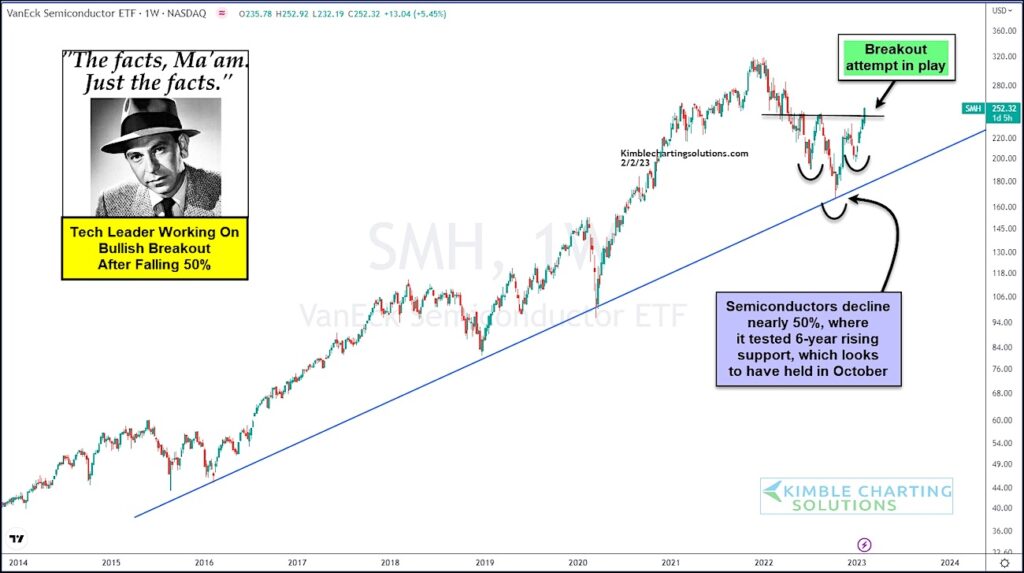
Today, we look at a “weekly” chart of the Semiconductors ETF (SMH). As you can see, SMH fell 50%, where it hit its 6-year rising trend support line, which looks to have held.
And the rally off this trend line looks like a full U-Turn may be in play! Strength of late has SMH working on a bullish breakout of an inverse head and shoulders pattern.
A breakout from this tech leader sends a bullish message the broader market. Stay tuned!
$SMH Semiconductor ETF “weekly” Chart
Note that KimbleCharting is offering a 2 week Free trial to See It Market readers. Just send me an email to services@kimblechartingsolutions.com for details to get set up.
Twitter: @KimbleCharting
Any opinions expressed herein are solely those of the author, and do not in any way represent the views or opinions of any other person or entity.

: Worrisome to Broader Market?")
