The resurgence in the stock market over the past year has been tech driven, as the COVID work-from-home theme picked up pace and shutdowns forced people to order goods and services online.
But lately, tech stocks have started to lose some steam and investors should take note.
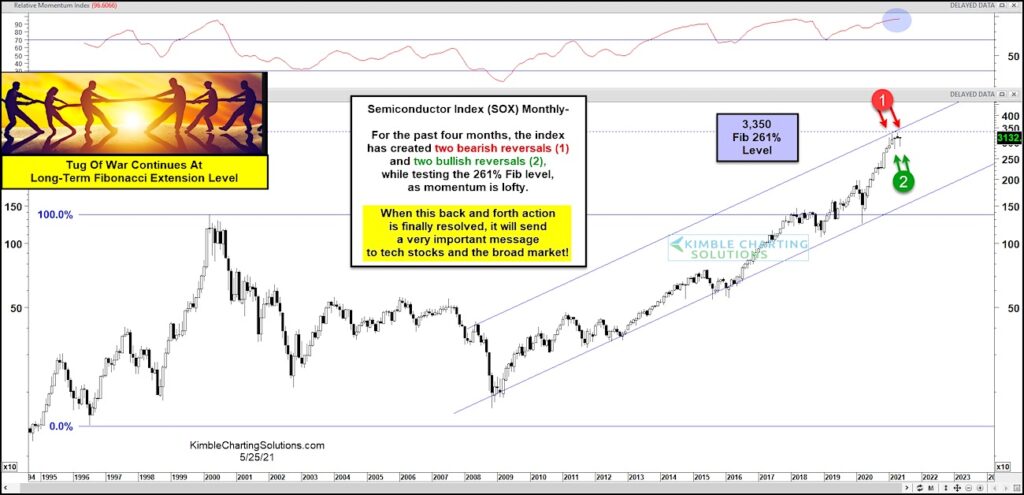
Today’s chart highlights this, as we look at a long-term “monthly” chart of a key tech leader: The Semiconductors Index (SOX).
As you can see, the SOX Semiconductors Index has been in a rising up-trend channel for much of the past 13 years with the index testing the upper end of the channel during the past 4 months. It is also testing a very important 261% Fibonacci extension level at the same time/price (and with momentum at lofty levels).
It is also notable that the SOX has put in 2 bearish reversals AND 2 bullish reversals during this time. Looks like a heck of a tug-o-war at a long-term Fib extension level for this important tech index. Stay tuned!
Note that KimbleCharting is offering a 2 week Free trial to See It Market readers. Just send me an email to services@kimblechartingsolutions.com for details to get set up.
Twitter: @KimbleCharting
Any opinions expressed herein are solely those of the author, and do not in any way represent the views or opinions of any other person or entity.


