The semiconductors are a critical sector within the technology universe of the stock market.
And as our economy becomes more technology focused, we need to follow this leadership sector to gauge where stocks and the economy may be headed.
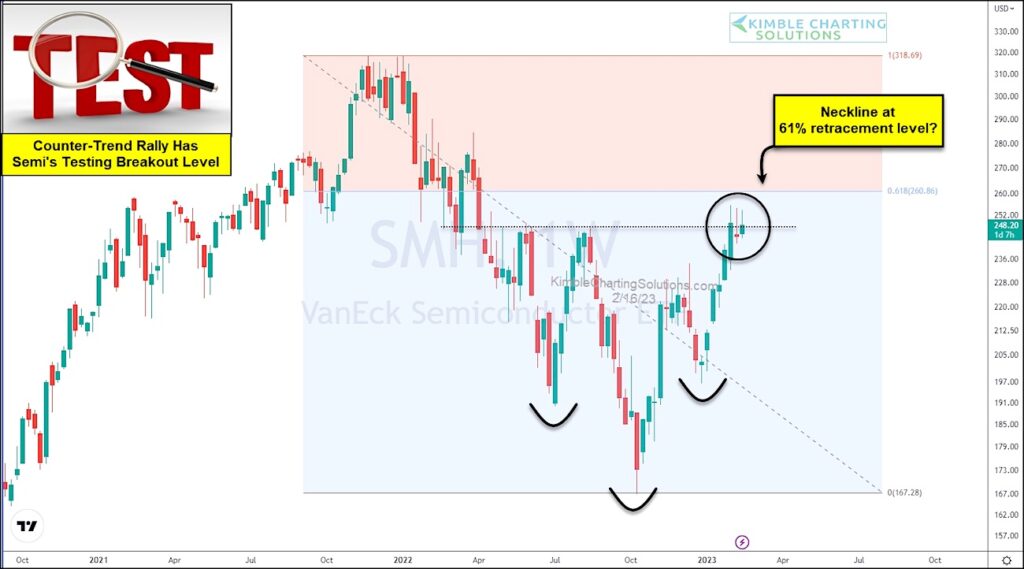
So today, we take another look at the Semiconductors ETF (SMH) on a “weekly” basis and highlight why it’s trading at a key price level.
As you can see, SMH has rallied sharply out of last October’s low. That rally has helped to form an inverse head and shoulders pattern. As well, the recent rally has brought the Semiconductors all the way back to its 61.8% Fibonacci retracement level.
But that’s not all… it is also the neckline resistance of the inverse head and shoulders pattern. A few weekly bars have shown attempts to breakout above this neckline, but none have succeeded as of yet. It goes without saying that a breakout would be bullish here. Will it happen? Stay tuned!
$SMH Semiconductors Sector ETF “weekly” Chart
Note that KimbleCharting is offering a 2 week Free trial to See It Market readers. Just send me an email to services@kimblechartingsolutions.com for details to get set up.
Twitter: @KimbleCharting
Any opinions expressed herein are solely those of the author, and do not in any way represent the views or opinions of any other person or entity.


