The Semiconductor Sector ETF (SMH) put in a major daily price reversal candle (around $15 or 6.3%). That is a significant turn around for a daily candle.
The decline was lead by stocks like Nvidia and Super Micro Computer. SMH currently sits about $20 or 8 percent off its highs.
On a longer term chart (weekly or monthly), this isn’t that big of a deal (yet!). When looking at a short-term daily chart, it does create quite a bit of psychological price resistance. We call this overhead supply. And so as price rallies into this vacuum, some are likely to sell because they missed out on selling the first time.
This is why Nvidia has paused here for several days.
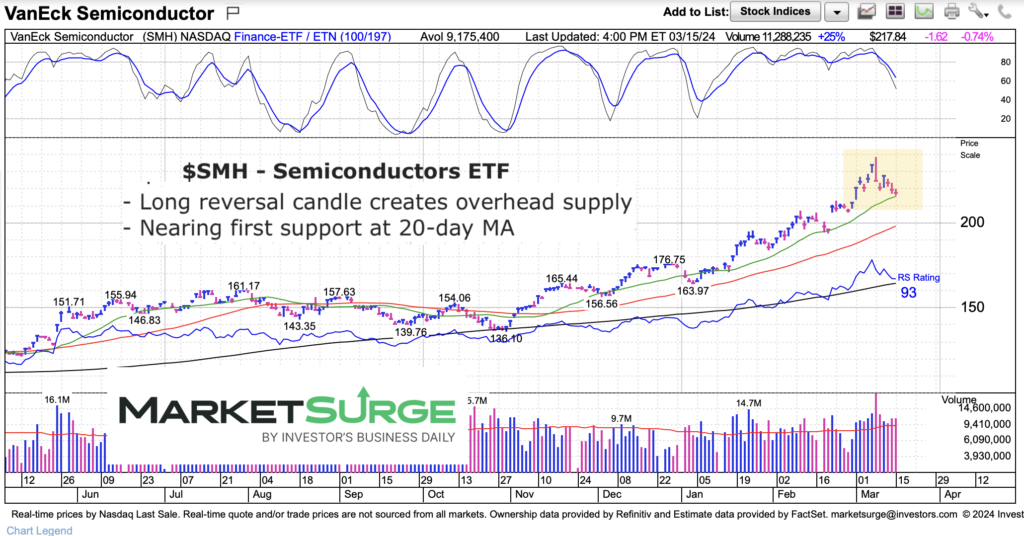
Right now it’s just the short-term “daily” chart. If buyers keep SMH in consolidation mode with some back and forth off the highs, it could set it up for another rally. However, it’s also worth noting that further selling could disrupt intermediate-term “weekly” charts and cause further damage to the bull case. See “daily” chart below.
Note that the following MarketSurge charts are built with Investors Business Daily’s product suite.
I am an Investors Business Daily (IBD) partner and promote the use of their products. The entire platform offers a good mix of tools, education, and technical and fundamental data.
$SMH Semiconductors Sector ETF Price Chart
Twitter: @andrewnyquist
The author may have a position in mentioned securities at the time of publication. Any opinions expressed herein are solely those of the author, and do not in any way represent the views or opinions of any other person or entity.
")


")
