Investors have been treated to one heck of a rally by the Semiconductor Sector (SMH) with stocks like Nvidia (NVDA) leading the sector and stock market higher.
But the semiconductor sector may be nearing a crossroads.
Is it breakout time or break time for the red hot semiconductors sector?
Today’s long-term “monthly” chart of SMH highlights this very conundrum.
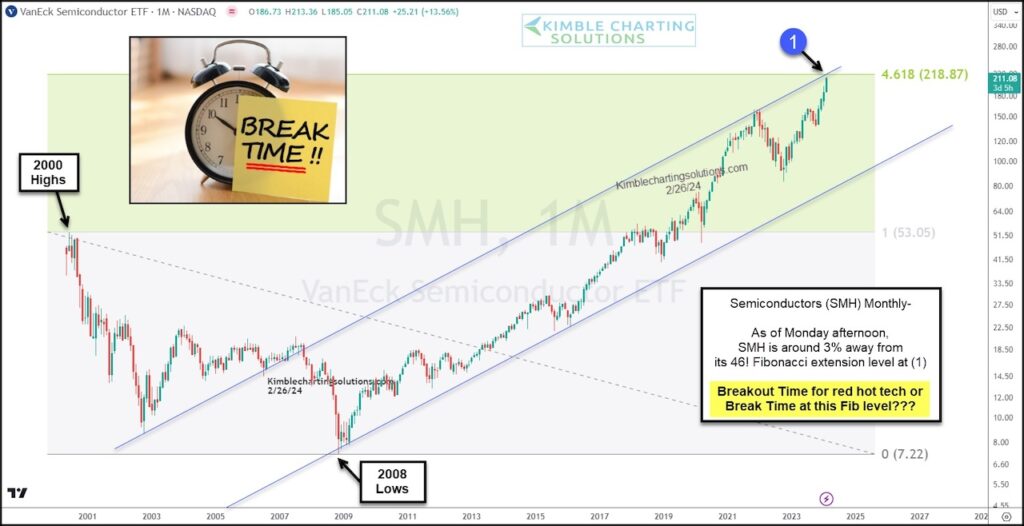
Currently, this market leading sector is trading around 3 percent below important dual resistance at (1). This level represents the top of a long-term trading channel as well as the 461.8% Fibonacci extension level.
A breakout would be a very bullish development for the stock market, while a consolidation or pullback may signal “break time” for the broader market. Stay tuned!
$SMH Semiconductors Sector ETF “monthly” Chart
Note that KimbleCharting is offering a 2 week Free trial to See It Market readers. Just send me an email to services@kimblechartingsolutions.com for details to get set up.
Twitter: @KimbleCharting
The author may have a position in mentioned securities. Any opinions expressed herein are solely those of the author, and do not in any way represent the views or opinions of any other person or entity.


 Flirting With Critical Support… Again")
