The semiconductor sector and stocks are getting hit hard by the current stock market correction. And it can be argued that weakness across the semiconductors was a “tell” that the market was weakening into October.
That said, let’s review today’s trading idea and setup (see chart below).
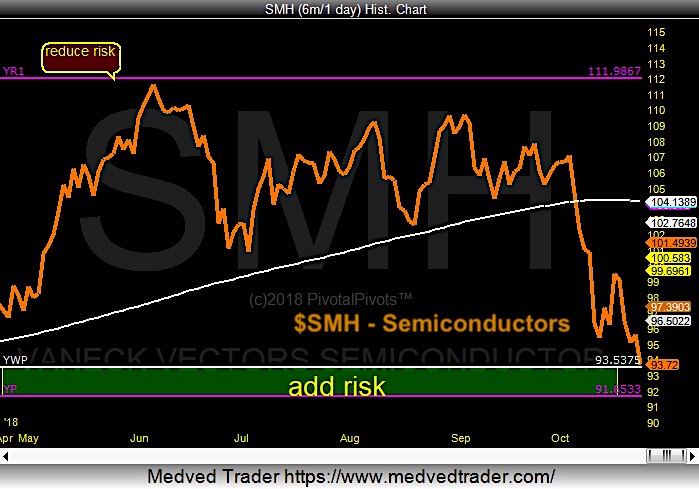
The Semiconductor ETF (NYSEARCA: SMH) high this year was at the yearly R1 Pivot. When price gets overbought at the yearly resistance pivot, it tends to pull back to the yearly pivot (YP).
If the Semiconductor Etf (SMH) is going to bounce, it should be here, around the yearly pivots(YP) at $91.65.
If the yearly pivots (YP) do not hold, then we’re looking at the yearly S1 pivots at $78.
However, if the yearly pivots (YP) do hold, the SMH could rally back up to the 250 day moving average around $104.
To learn more about yearly pivot points, please check out my “Using multiple pivot points for trading opportunities” webinar.
Semiconductors ETF (SMH) Chart w/ Yearly Pivots
Twitter: @Pivotal_Pivots
The author may have a position in mentioned securities at the time of publication. Any opinions expressed herein are solely those of the author, and do not in any way represent the views or opinions of any other person or entity.

")


 Rolling Over At Key Fibonacci Level?")

")