 Since the Tech bubble burst over a decade ago, fits and starts have mired “mature” large cap tech stocks into an out of favor, underperforming slump. Highlighting just how boring they have become was Cisco Systems (CSCO) announcement that they would start paying a dividend. The stock bounced a few percent, then flat lined for a couple of weeks. But, in an odd contrarian twist, boring may be just what the doctor ordered… at least, over the short term. Why, you say? Well, this action, combined with a growing negativity surrounding the stock, may be enough to turn over a new leaf of investors and carve out a bottom. And, although paying a dividend isn’t the sexiest move for growth investors, it could pay off over time as portfolio managers look for a combination of growth and stability to navigate through additional uncertainty. Either way, the charts will be our guide, and the lines of resistance our rules. In this week’s annotated chart column, we will take a closer look at Cisco’s prospects, as well as the technical set-ups of fellow large cap dividend payers Microsoft (MSFT) and Yahoo (YHOO).
Looking at Cisco’s long term chart, the first thing that sticks out is the narrowing long term wedge. Its resistance lines provide active investors a range to work with over the near term. Buying in and around here appears safe, as the stock recently landed on the long term up trend line. This may work to 22-23 before meeting stronger resistance. Stops can be placed just below 17, and adjusted accordingly. More importantly, however, is the looming break out of this wedge which will determine long term trending.

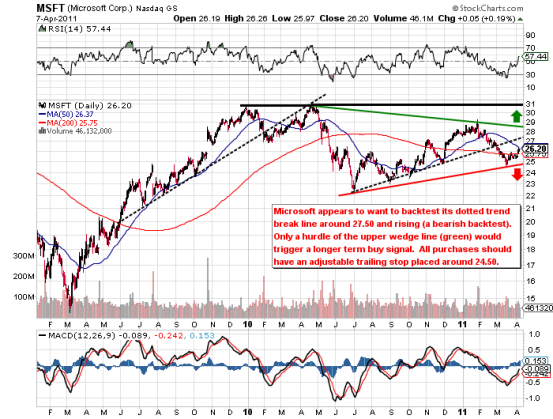
Microsoft has also formed a short term wedge, and after its recent rally, has found itself nearing the 50 DMA around 26.50. If this level is hurdled, additional resistance looms overhead at 27.50 (dotted rising back test) and the upper wedge line at 28.50. Any purchases require a stop just below 25.
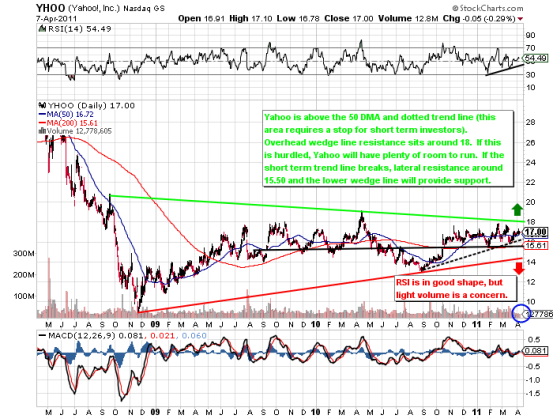
Lastly, we have Yahoo, which looks poised for a move through its upper wedge line. But, due to a recent volume stall, the stock may need a restart from lateral resistance around 15.50 – 16.00 to gather enough steam. Support is located at the dotted trend line and 50 DMA around 16.50 to 16.75. Depending on risk tolerance, stops can start here, or be placed at the lower lateral resistance line.
Only time will tell for these aging techies… but the charts and technicals will always produce the framework to guide your investments. Have a good weekend.
Author’s note: Cisco’s chart was replaced 4/13/11 due to a technical issue.
Previously published as a blog by Minyanville.
—————————————————————-
Your comments and emails are welcome. Readers can contact me directly at andrew@seeitmarket.com or follow me on Twitter on @andrewnyquist. Thank you.
No positions in any of the securities mentioned at time of publication.
Any opinions expressed herein are solely those of the author, and do not in any way represent the views or opinions of his employer or any other person or entity.


: Showing Some Signs of Emerging Strength")
