Stocks will look to recover in the week ahead after a bout of selling.
One area of the market that I think is key is small caps… and the Russell 2000.
If the major indices are going to embark on another strong wave higher, they will need small cap stocks to break out of their sideways slog.
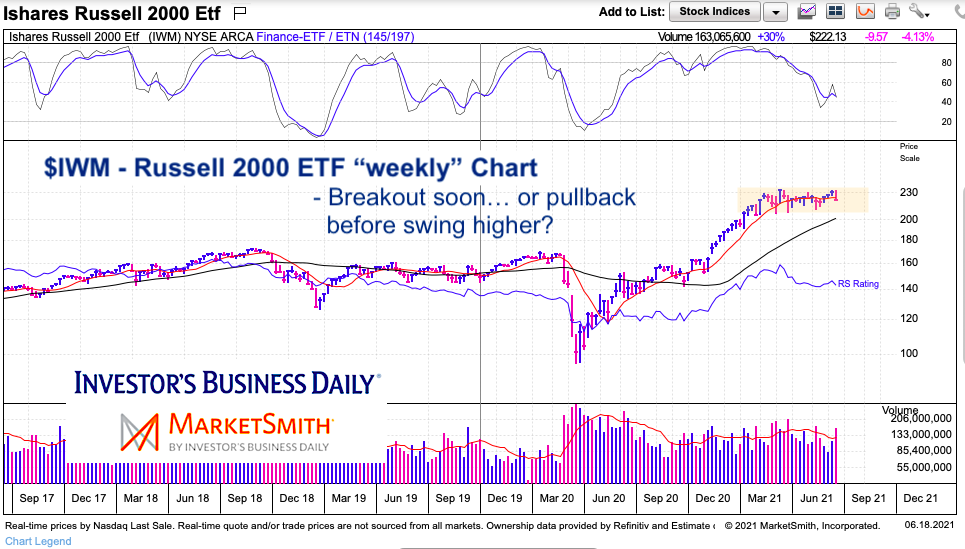
Today’s chart is simple and easy to follow. It’s a “weekly” chart of the Russell 2000 that highlights the sideways consolidation that followed the big rally up from the March low.
Note that the following MarketSmith charts are built with Investors Business Daily’s product suite.
I am an Investors Business Daily (IBD) partner and promote the use of their products. The entire platform offers a good mix of technical and fundamental data and education.
$IWM Russell 2000 ETF “weekly” Chart
The Russell 2000 is still in consolidation mode. Price is currently in the middle of a sideways channel and won’t be deemed “bullish” until we see a breakout over the top of the channel.
The rally off the March low is bullish and a pullback will likely provide opportunity for longer-term investors. A break below $200 will signal a deeper correction and, if available, a move to $180 area would be ideal (that retests last Fall’s major breakout).
Twitter: @andrewnyquist
The author may have a position in mentioned securities at the time of publication. Any opinions expressed herein are solely those of the author, and do not in any way represent the views or opinions of any other person or entity.


