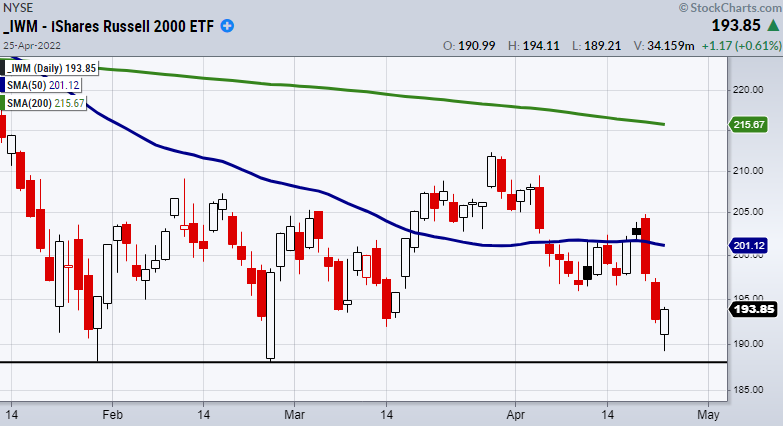
Monday, the small-cap index Russell 2000 (IWM) found support near the bottom of its range.
After last week’s selling, this could either be a temporary bounce or a fake-out before weakness again sets in.
Because we are looking at the stock market from a rangebound perspective, we see the potential for dip-buying opportunities if tight risk parameters are used.
On another note, we are in earnings season which can add another layer of volatility as big names can affect the market.
Microsoft will report earnings on April 26th followed by Facebook/Meta Platforms (FB) on April 27th.
Therefore, keep an eye out for earnings and watch for upside potential based on support from range lows in the major indices. Or if it breaks, it could be a takeout.
Watch Mish’s latest appearance on BNN Bloomberg!
Stock Market ETFs Trading Analysis & Summary:
S&P 500 (SPY) Watch for a close over Monday’s high of 428.
Russell 2000 (IWM) Found support near the bottom of the range. Needs to hold over 189.
Dow (DIA) 336 support area.
Nasdaq (QQQ) 333 new support.
KRE (Regional Banks) 63.80 support area.
SMH (Semiconductors) 237 pivotal.
IYT (Transportation) 242 support.
IBB (Biotechnology) 118 next support. Needs to clear back over 50-DMA at 127.
XRT (Retail) Watch Monday low as new support at 71.90.
Twitter: @marketminute
The author may have a position in mentioned securities at the time of publication. Any opinions expressed herein are solely those of the author and do not represent the views or opinions of any other person or entity.

 Flirting With Critical Support… Again")


